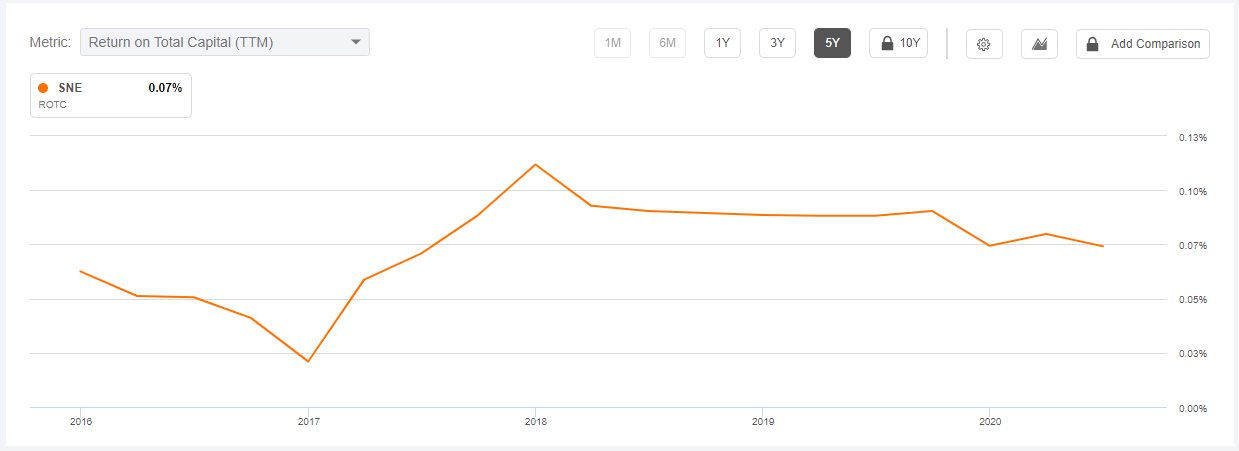
return on total capital graph

https://seekingalpha.com/symbol/SNE/charting?metric=rotc
With Sony as an example, the return graph is 0.07% vs. the actual return on capital of 7-8%
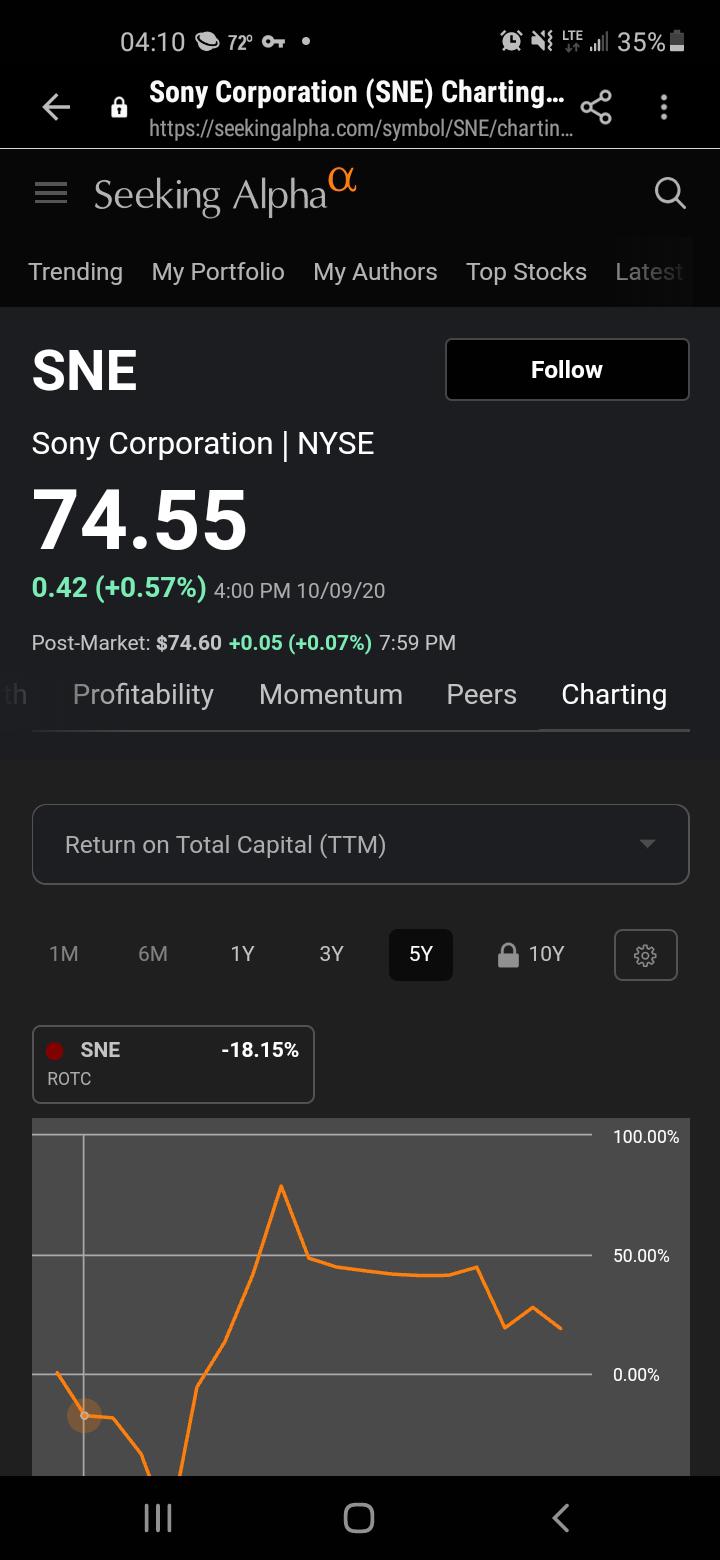
https://seekingalpha.com/symbol/SNE/charting?metric=rotc
With Sony as an example, the return graph is 0.07% vs. the actual return on capital of 7-8%

Hi Global Dividend Stocks,
Thanks for bringing this to our attention, I've escalated the issue with our technology team and it should be fixed soon.
Regards,
Kushal Mehrotra
Data QA Analyst, Seeking Alpha