Charts and Percentages

I’d like to know how these percentages are calculated since they are all different. At first I though that the summary chart maybe just didn’t include the current price when compared to the Advanced chart but that doesn’t really work out either.
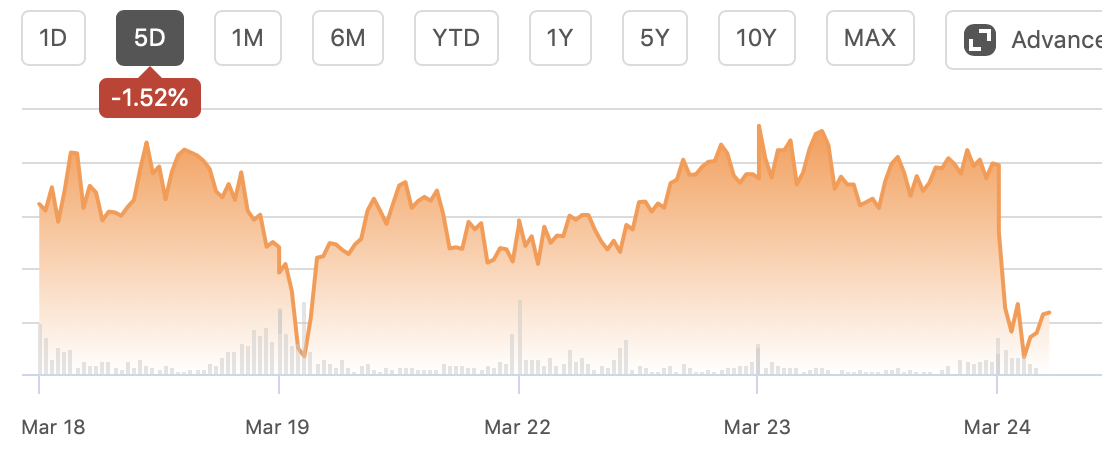
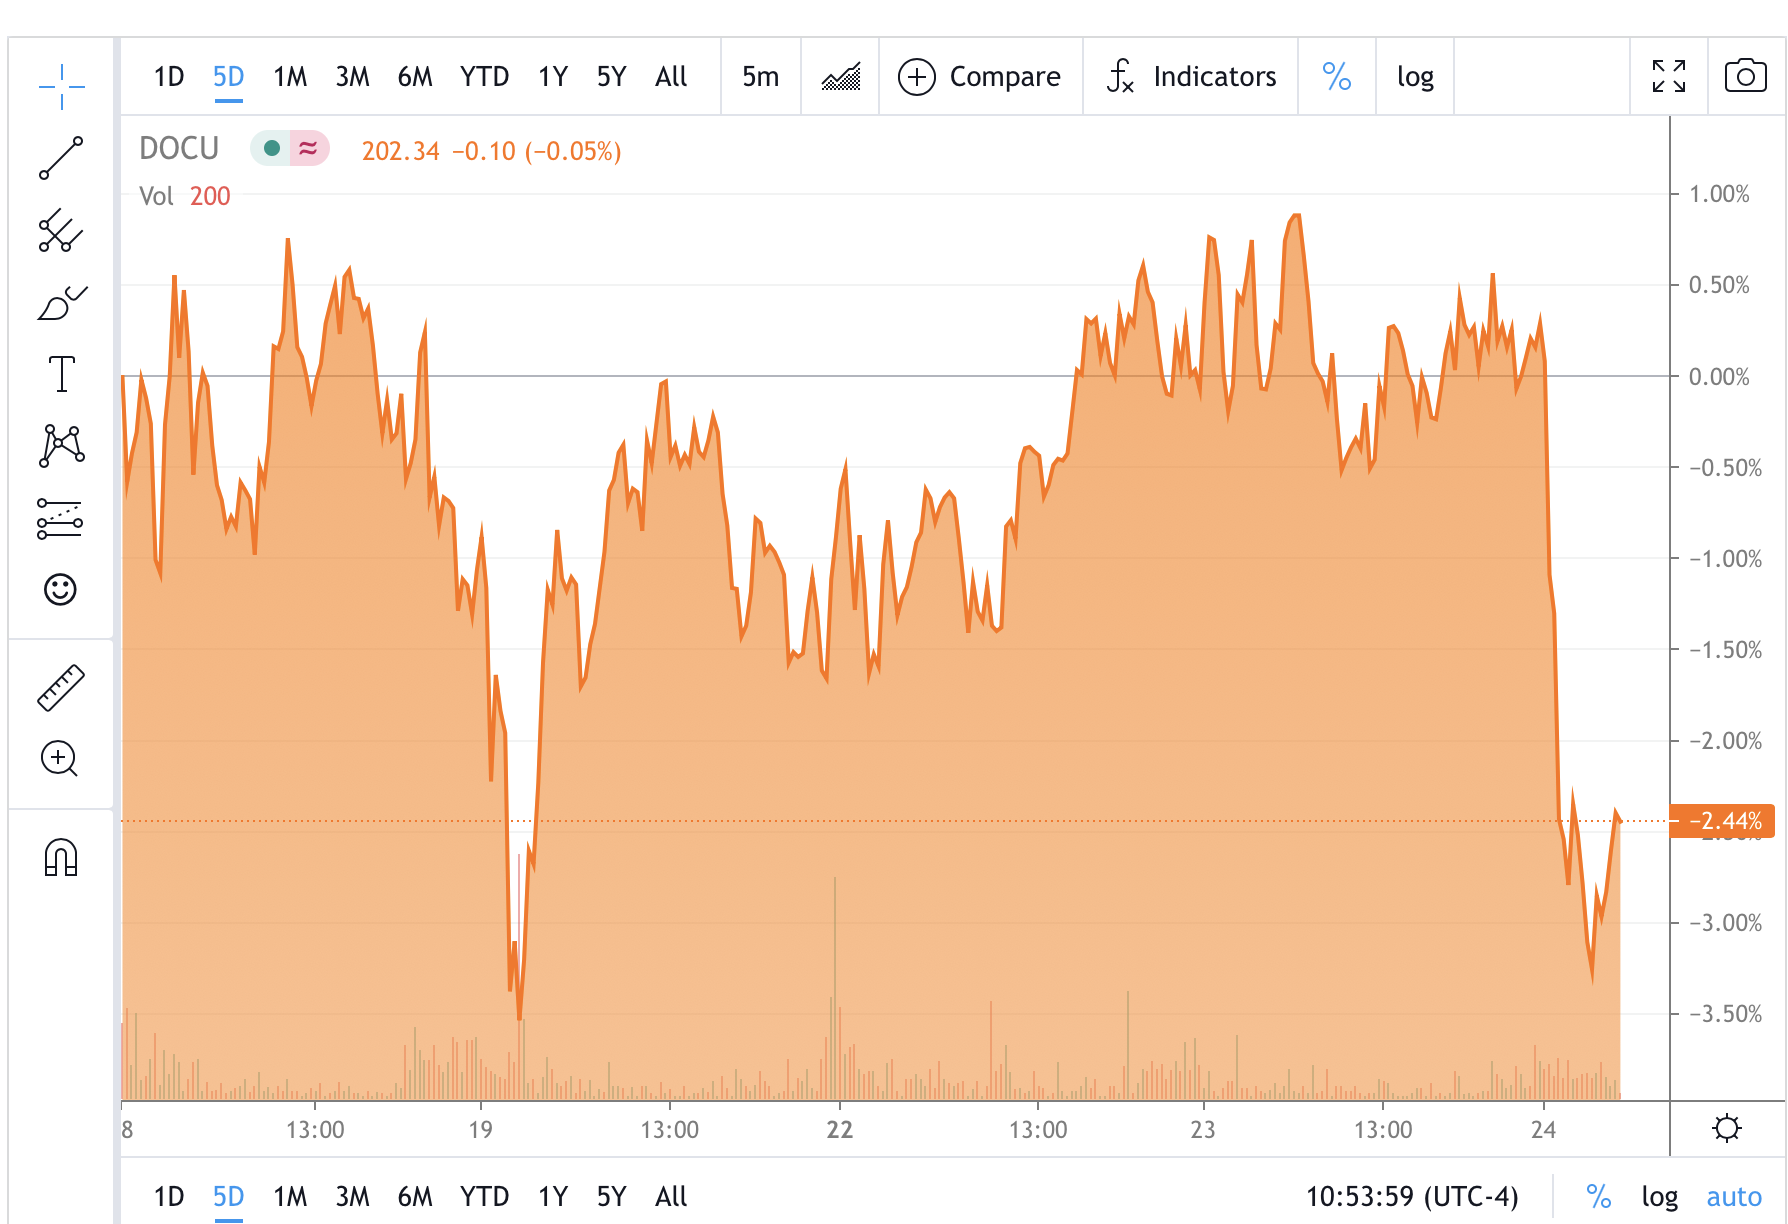
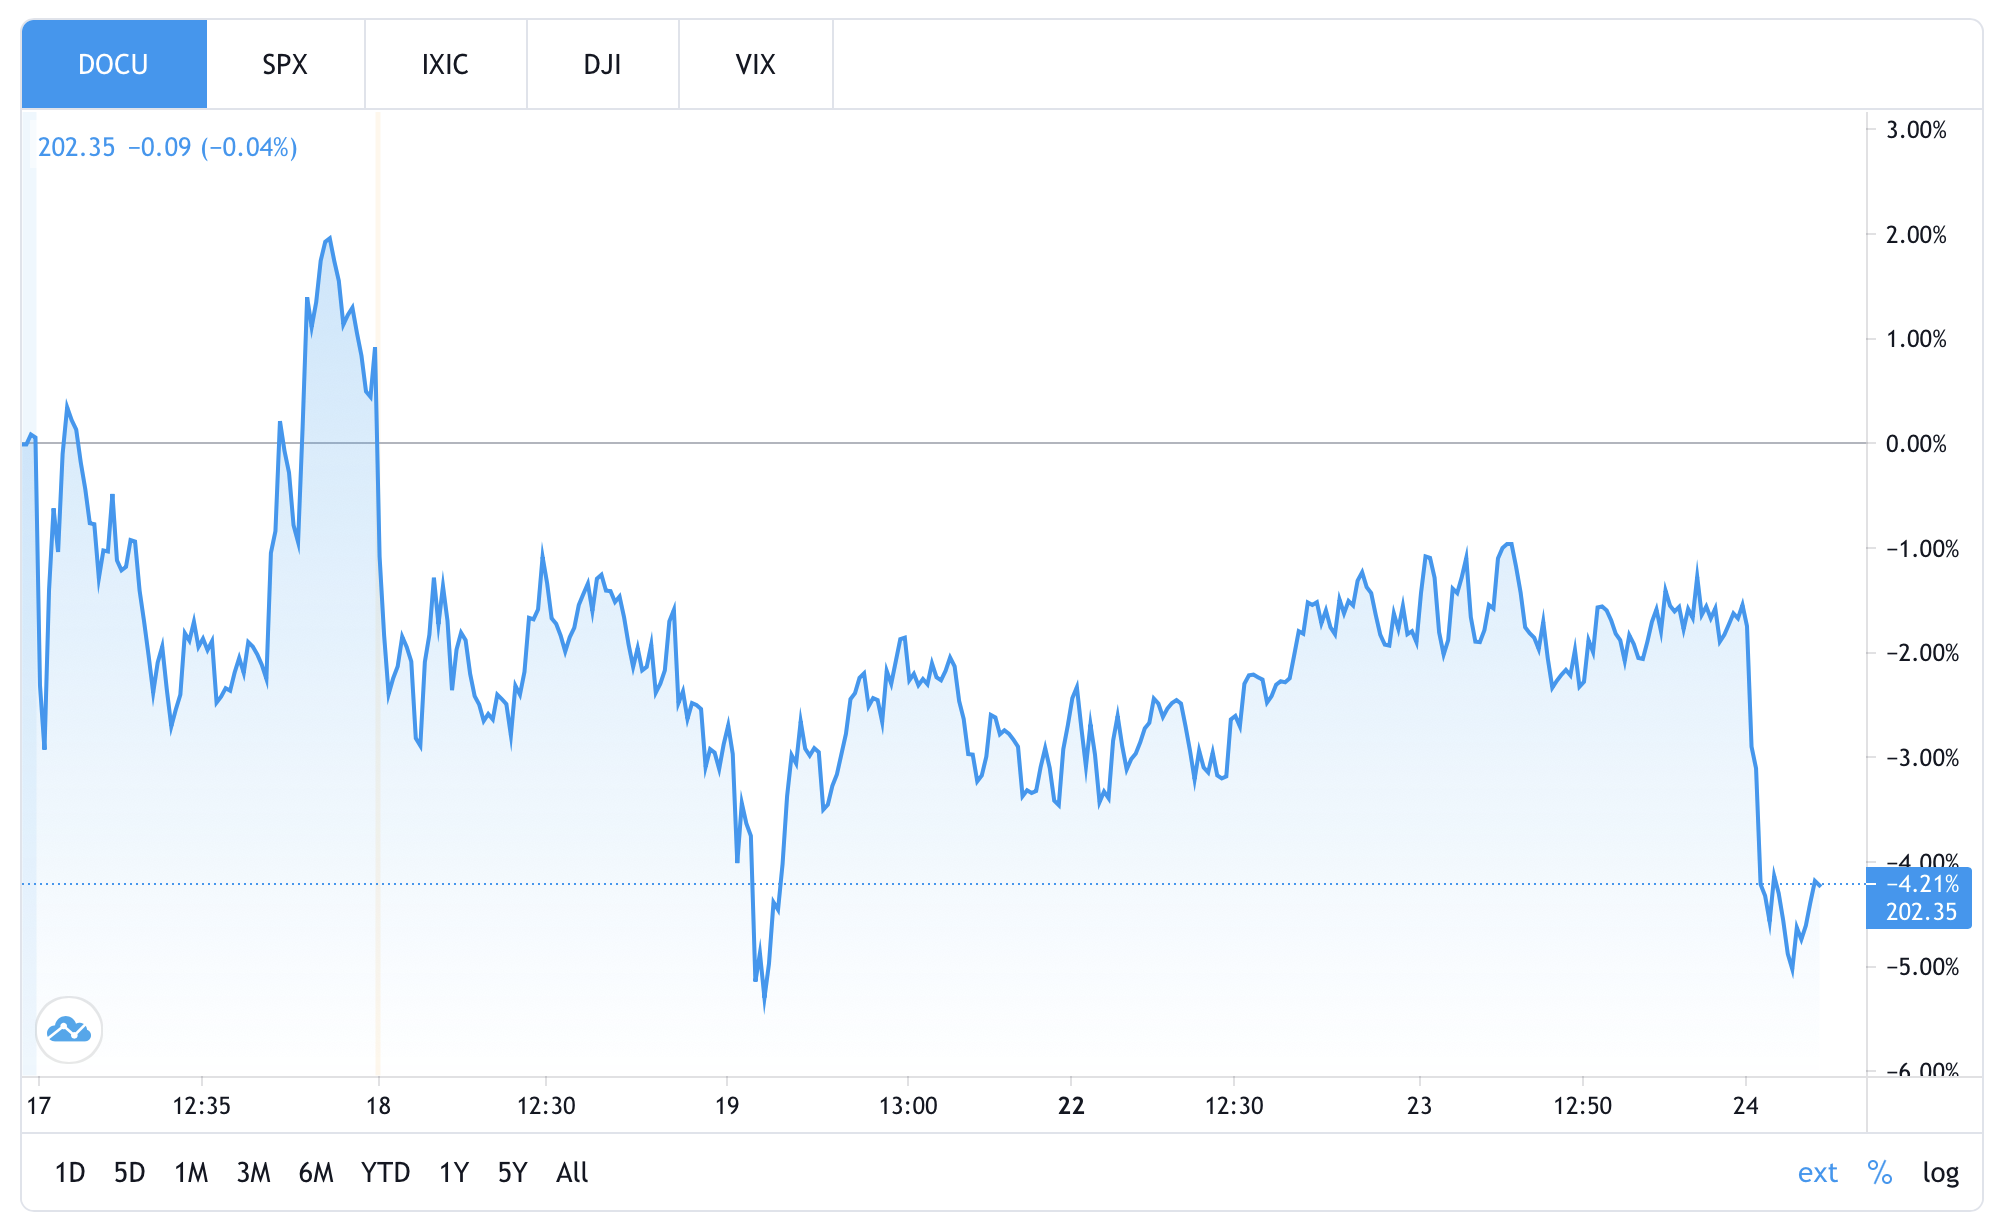
Then I clicked through on the link at the bottom of the chart for TradingView (the software used for charting) and their chart then shows another different %. They are all not close to each other seen below. They list - 1.52%, -2,.44% and then -4.21%. Is this a matter of what’s considered the open price on day 1? Maybe extended hours or something?
Seems pretty important to be consistent here and I’m not sure the % on the summary is worth showing at all.
I’d love to understand what’s what here so I know which to look at.