Short interest trend graph - suggestion

I want to suggest having the information about "Short Interest %" in terms of the trend - not only the actual/current value (as of today). A graph or a table with historical values would be great.
As a rationale for the request:
This piece of information (historical short interest %) is very relevant, namely when analyzing the market sentiment about a particular stock - i.e. 7% can be considered high in some cases, but if it comes from a 15% on the month before, it turns into a completely different scenario.
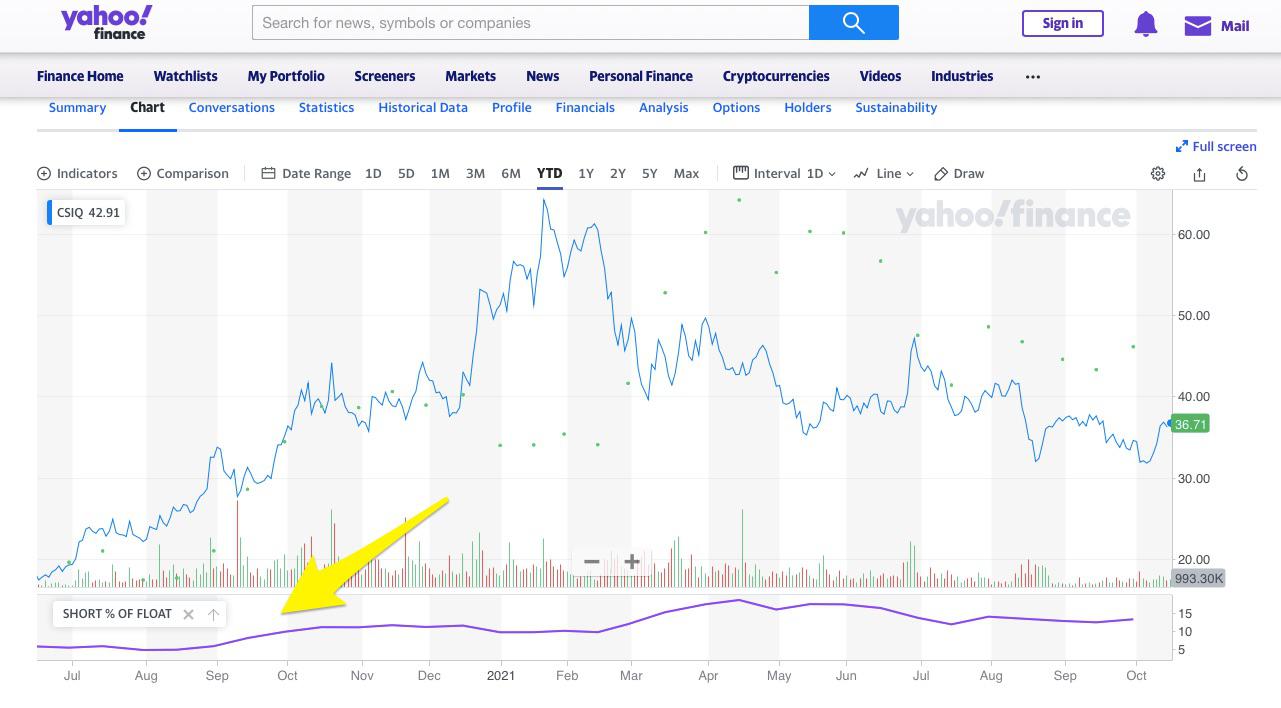
Currently, I can get this information on Yahoo Finance (free version) directly on the graph tool. It would be great if we could have this same information on SA. Check image below:
I appreciate in advance your attention to this topic.
Kind regards,