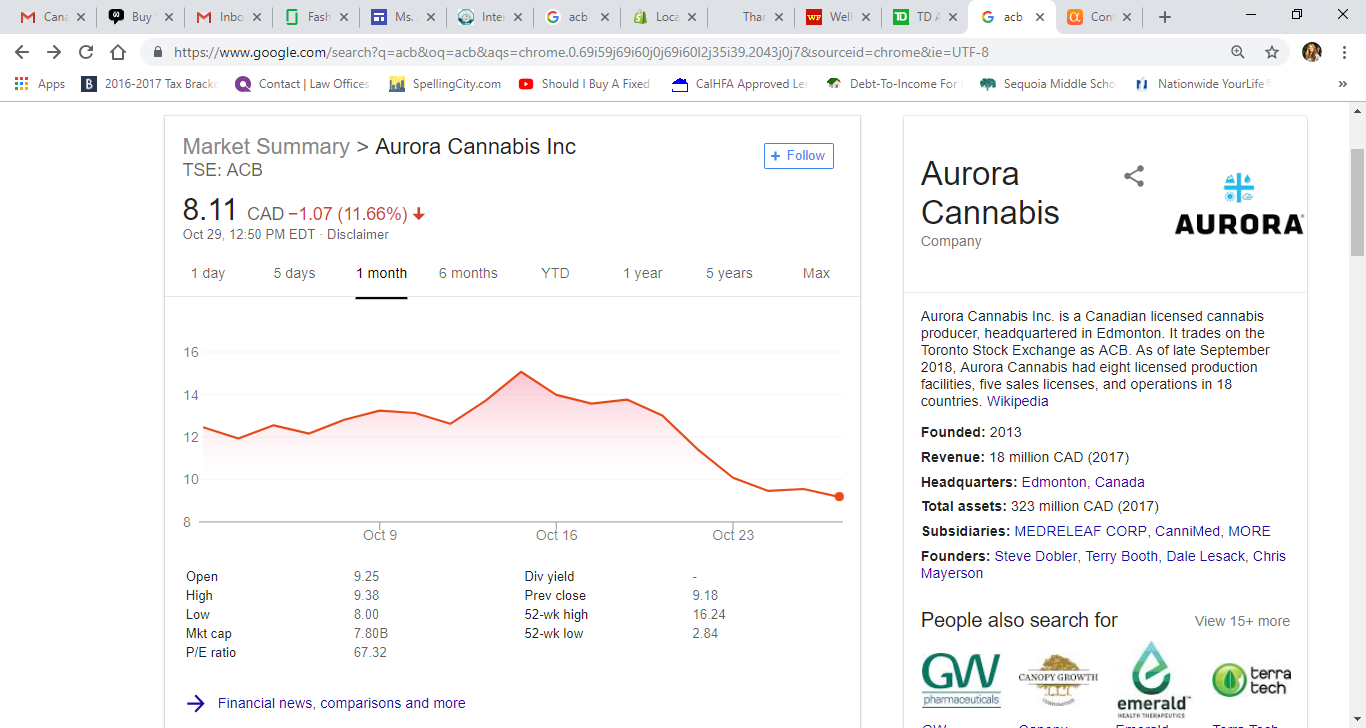
ACB chart is an error or a scam

I owned ACB prior to NYSE participation and after. The stock was clearly at over 12 just less than 2 weeks ago. It came down to 10 at which point I bought more shares. Now your chart shows that the price was never above 8 for the last month which is TOTAL MISINFORMATION. Yahoo still has the CORRECT chart posted which I have posted a screenshot of from today. Is this a total scam on the part of the stock market or of your own??
--
Heather M. Swanson
--
RSVP ASAP.
Thank you,
Heather Swanson
(805) 279-5078
Sincerely,
Financial Planning Assistant
31330 Oak Crest Drive, Suite 101
Westlake Village, CA 91361
Cell: (805) 279-5078
Financial Fitness with Team Olympus
Safer | Smarter | Stronger
Hi. The example you're showing is from the Toronto Stock Exchange and in CAD. Our chart of the stock is on the NYSE and is showing the price near $12 about 2 weeks ago.