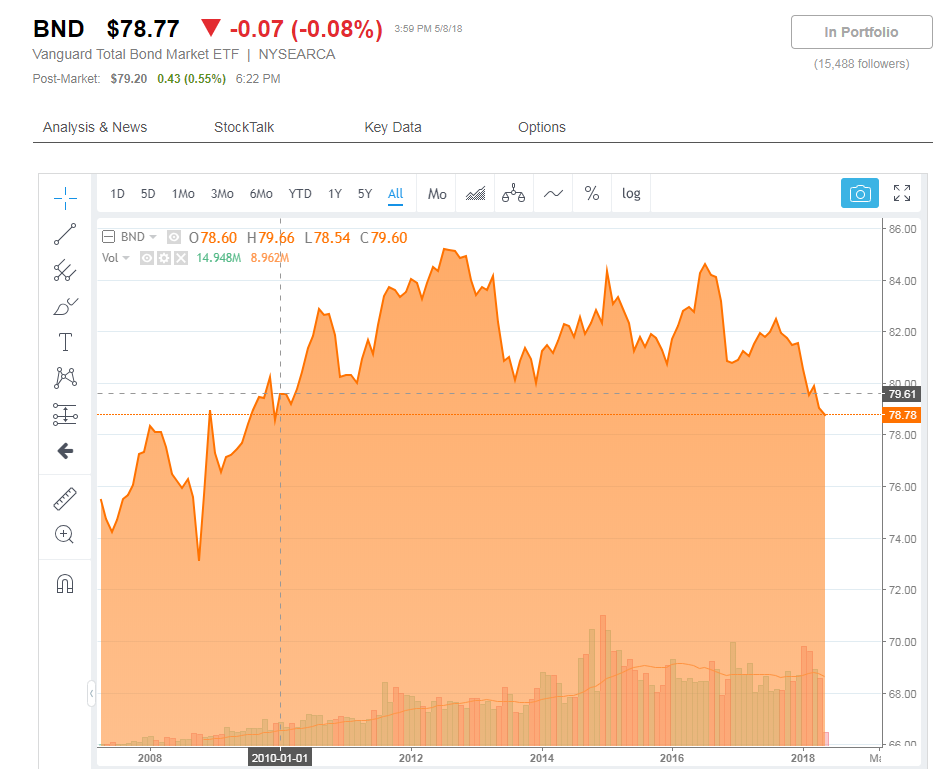
BND (Vanguard Total Bond Market ETF) 10 year graph incorrect

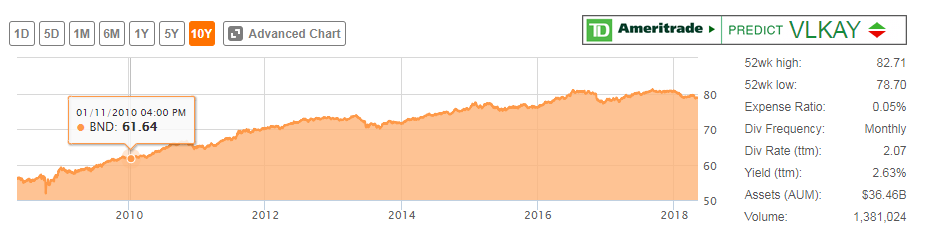
For some reason the data that is used for the 10 year graph is completely different than the data that is being used in the advanced chart. The data in the advanced chart seems to be correct.

Hi,
Thanks so much for reporting this and for including these detailed images. The difference in charts is caused by the handling of dividends. The basic chart adjusts historical prices for dividends. We are re-evaluating this approach and may change this.
Thanks,
Daniel