Bug with 3 month and 1 year charts (iOS app)

I've noticed that with most of the stocks in my portfolio, some of charts are plotted incorrectly. I'm on an iPhone 8, iOS 12.0.1, and Seeking Alpha app version 3.10.5 (2143).
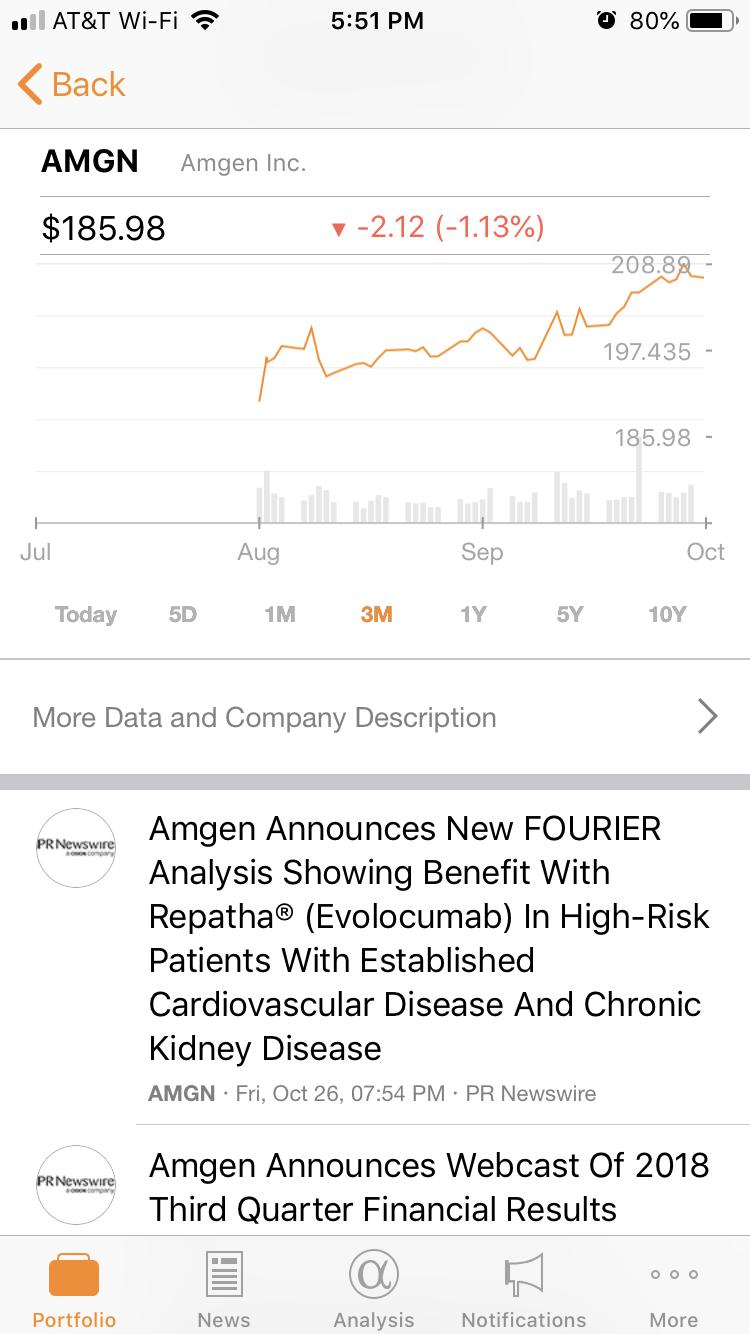
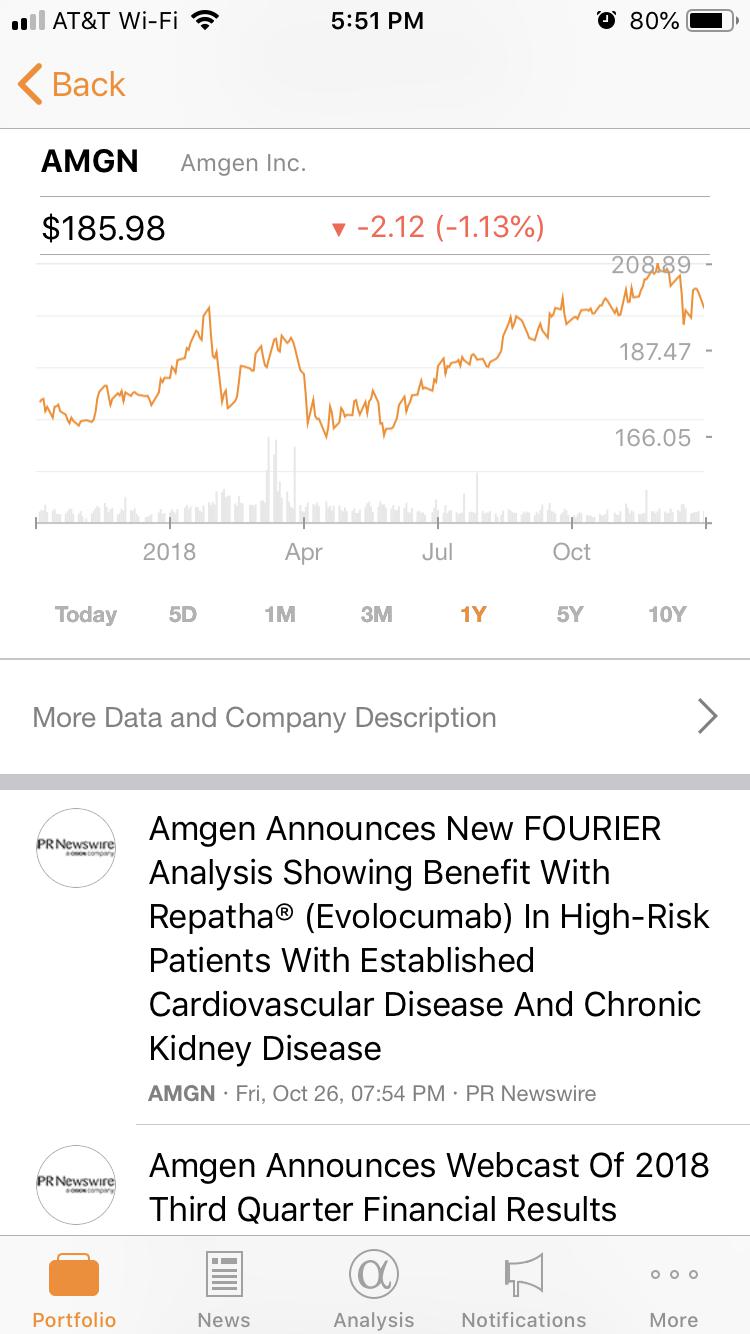
For instance if you look at the attached screenshots for stock symbol "AMGN", you can see that for the price of $185.98, the charts for 3 months (attachment "3M") and 1 year (attachment "1Y") are plotted incorrectly.