Advanced Chart Features- A brief about what the various buttons on the advanced chart denote
To view the Advanced Chart, open any symbol page and next to the "Basic ", you will see the option to see the "Advanced Chart" (as shown below).
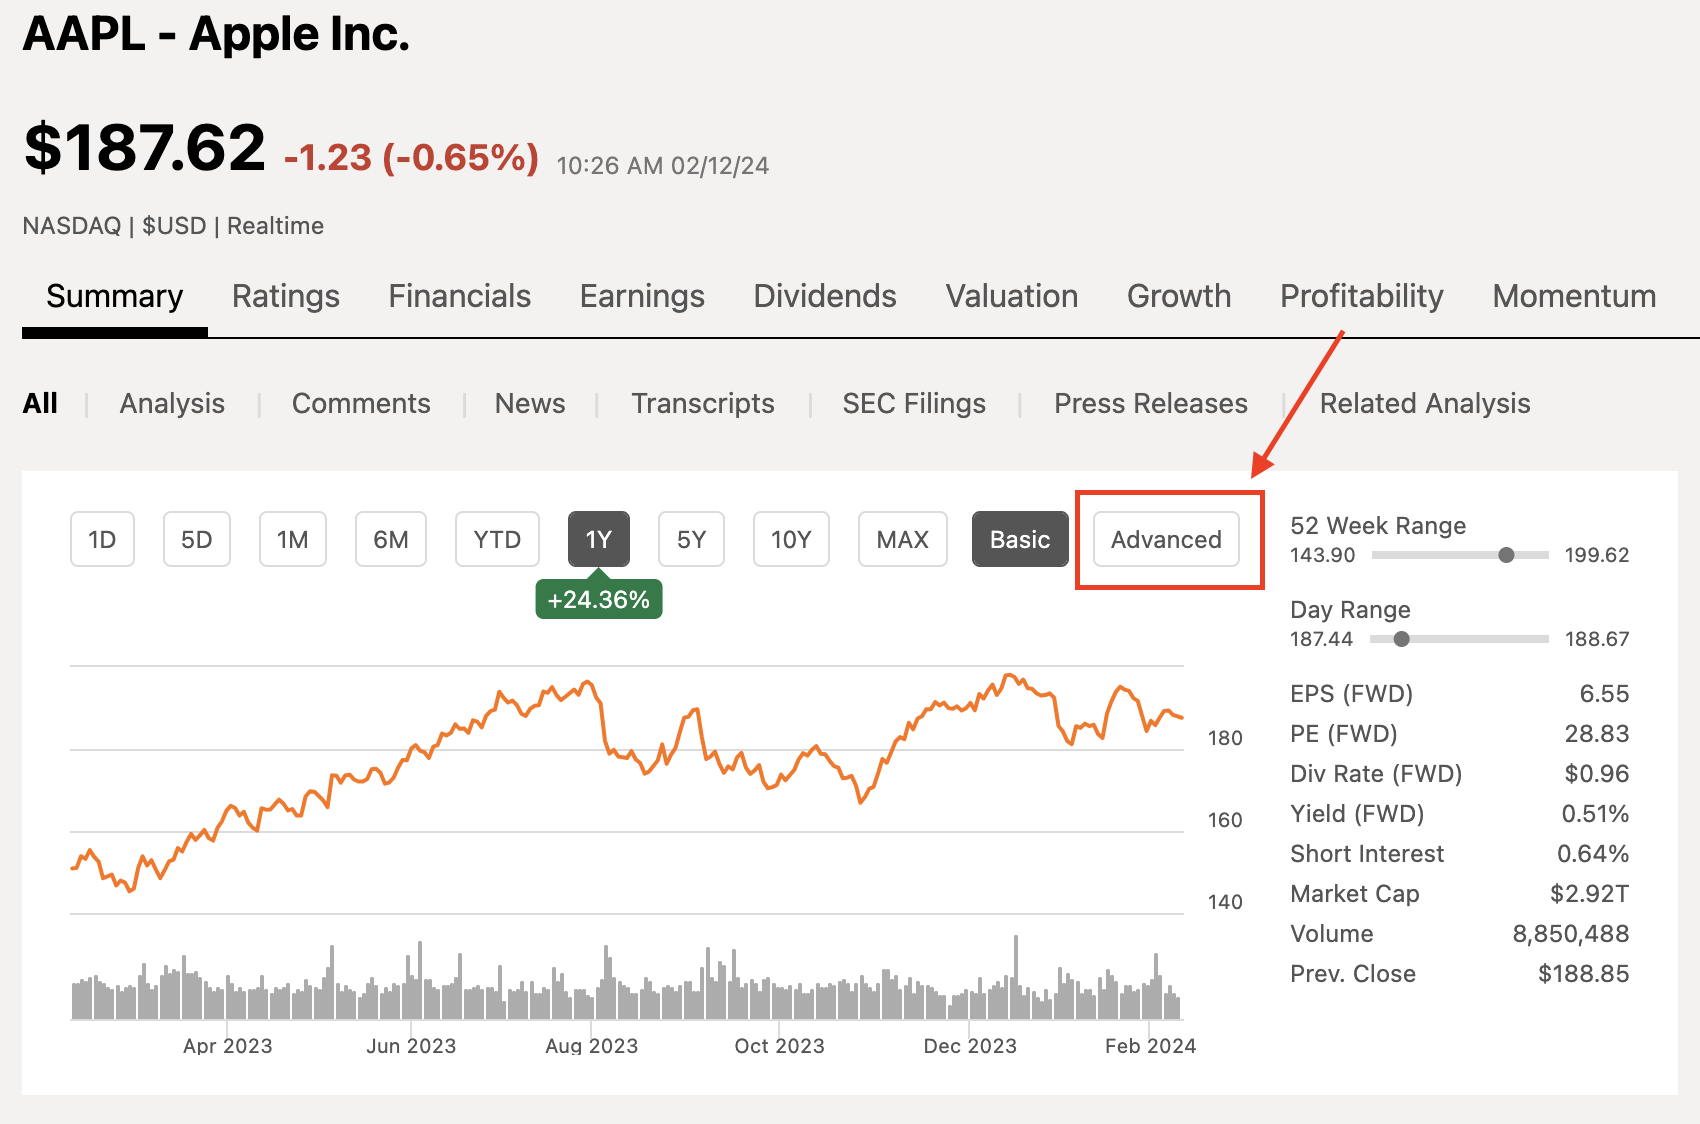
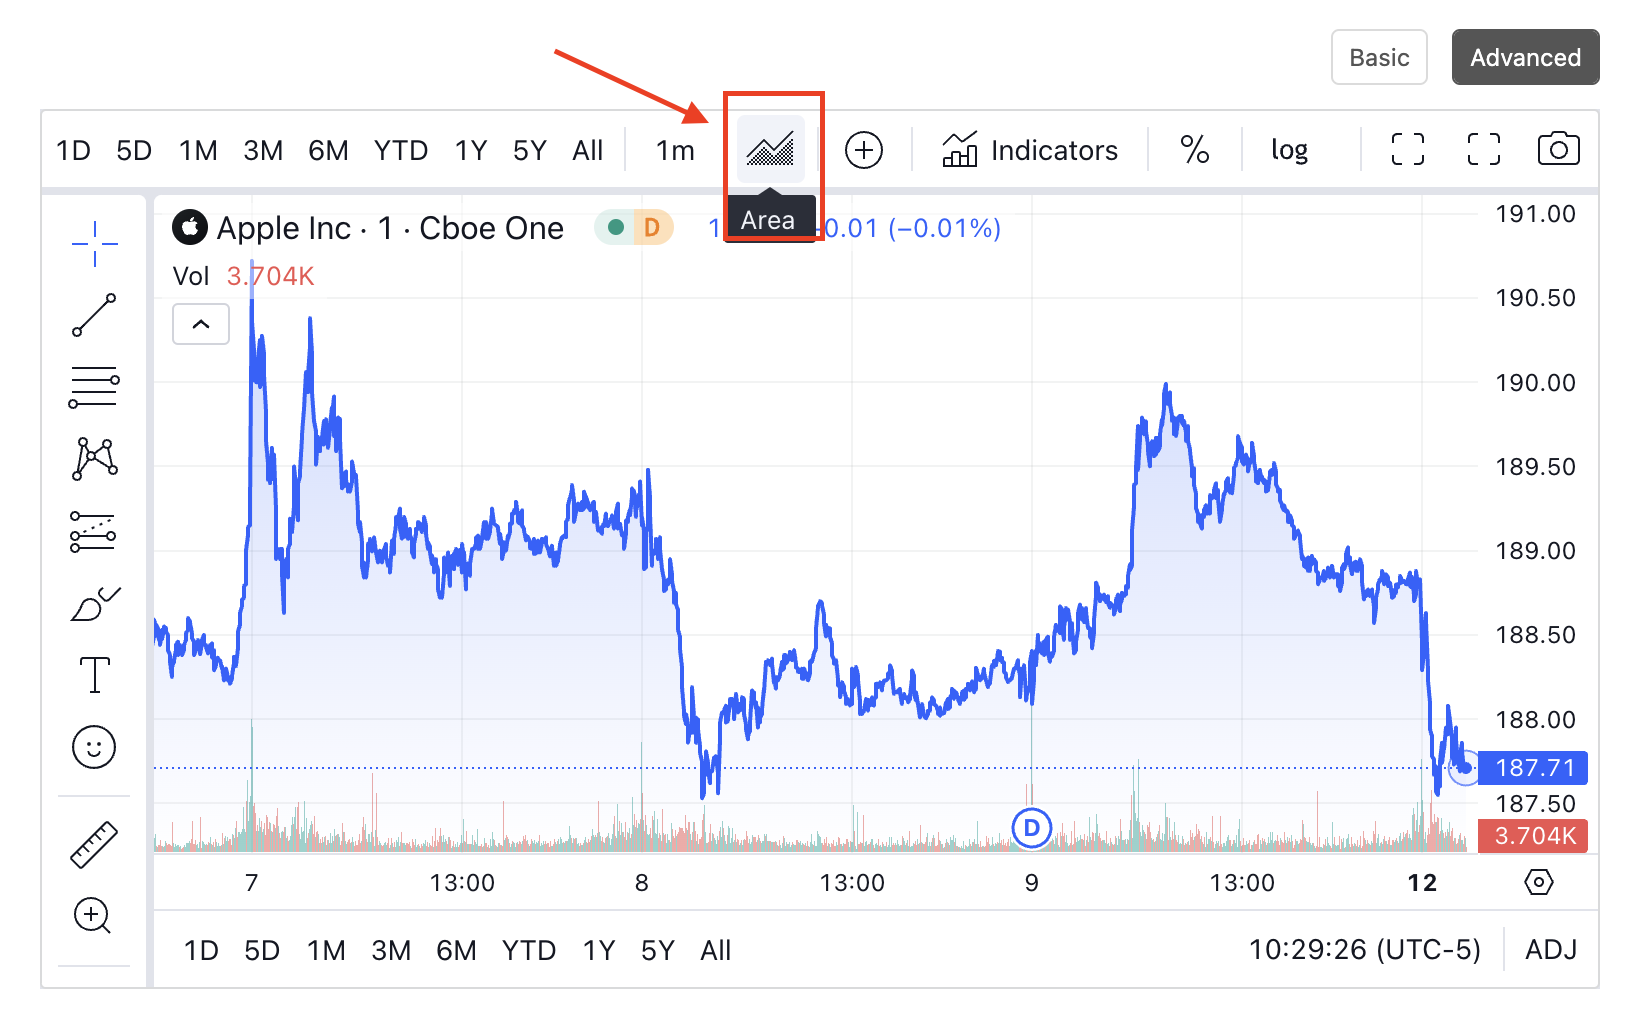
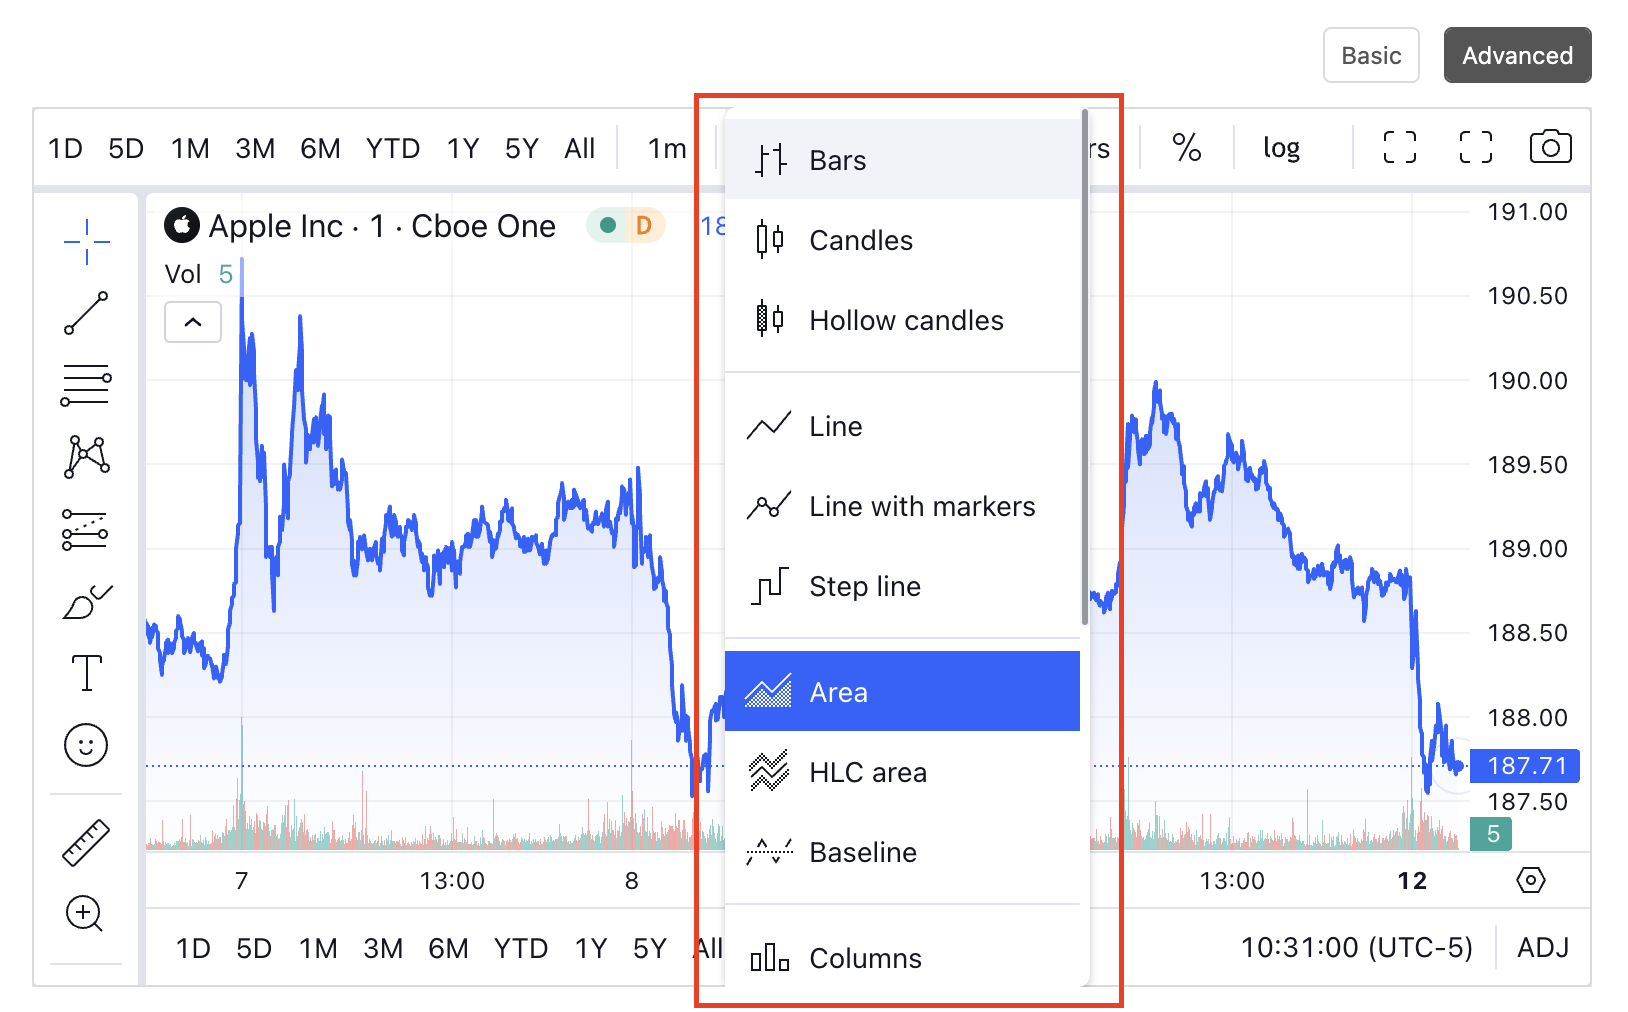
Chart Type Dropdown - allows you to toggle between the different chart types like bar, candle, line etc.
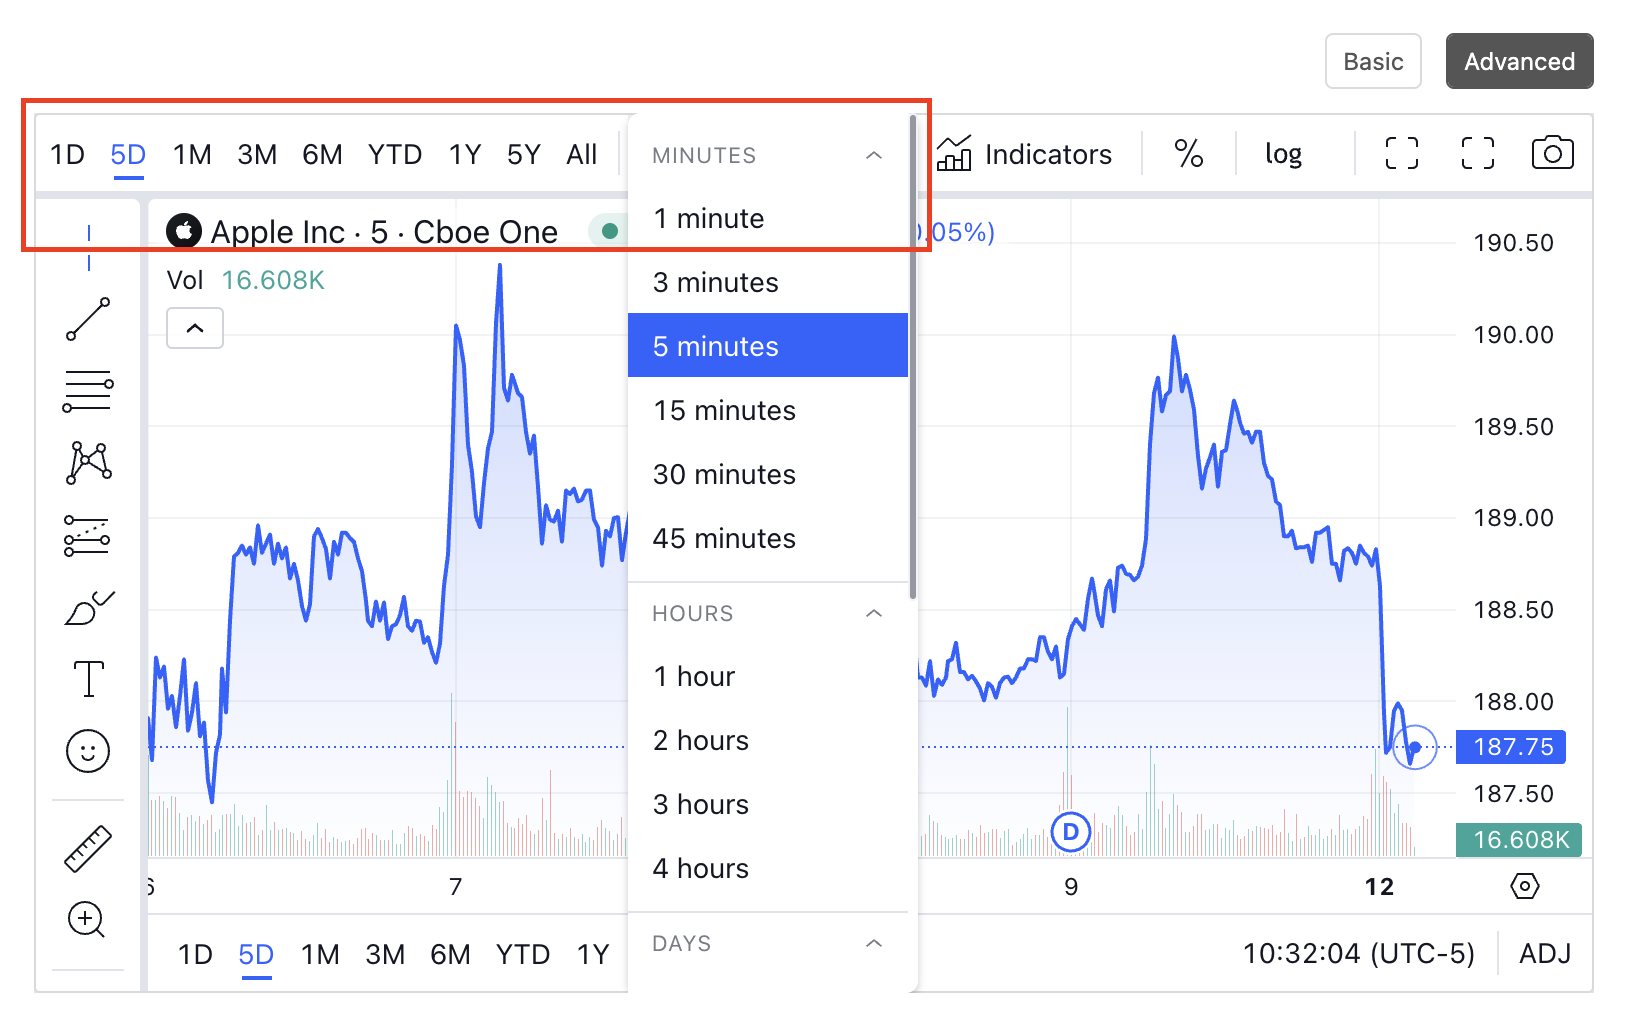
Period - Select the desired period (Ex. of the candle) from here. The period can be anything from minutes to days/weeks
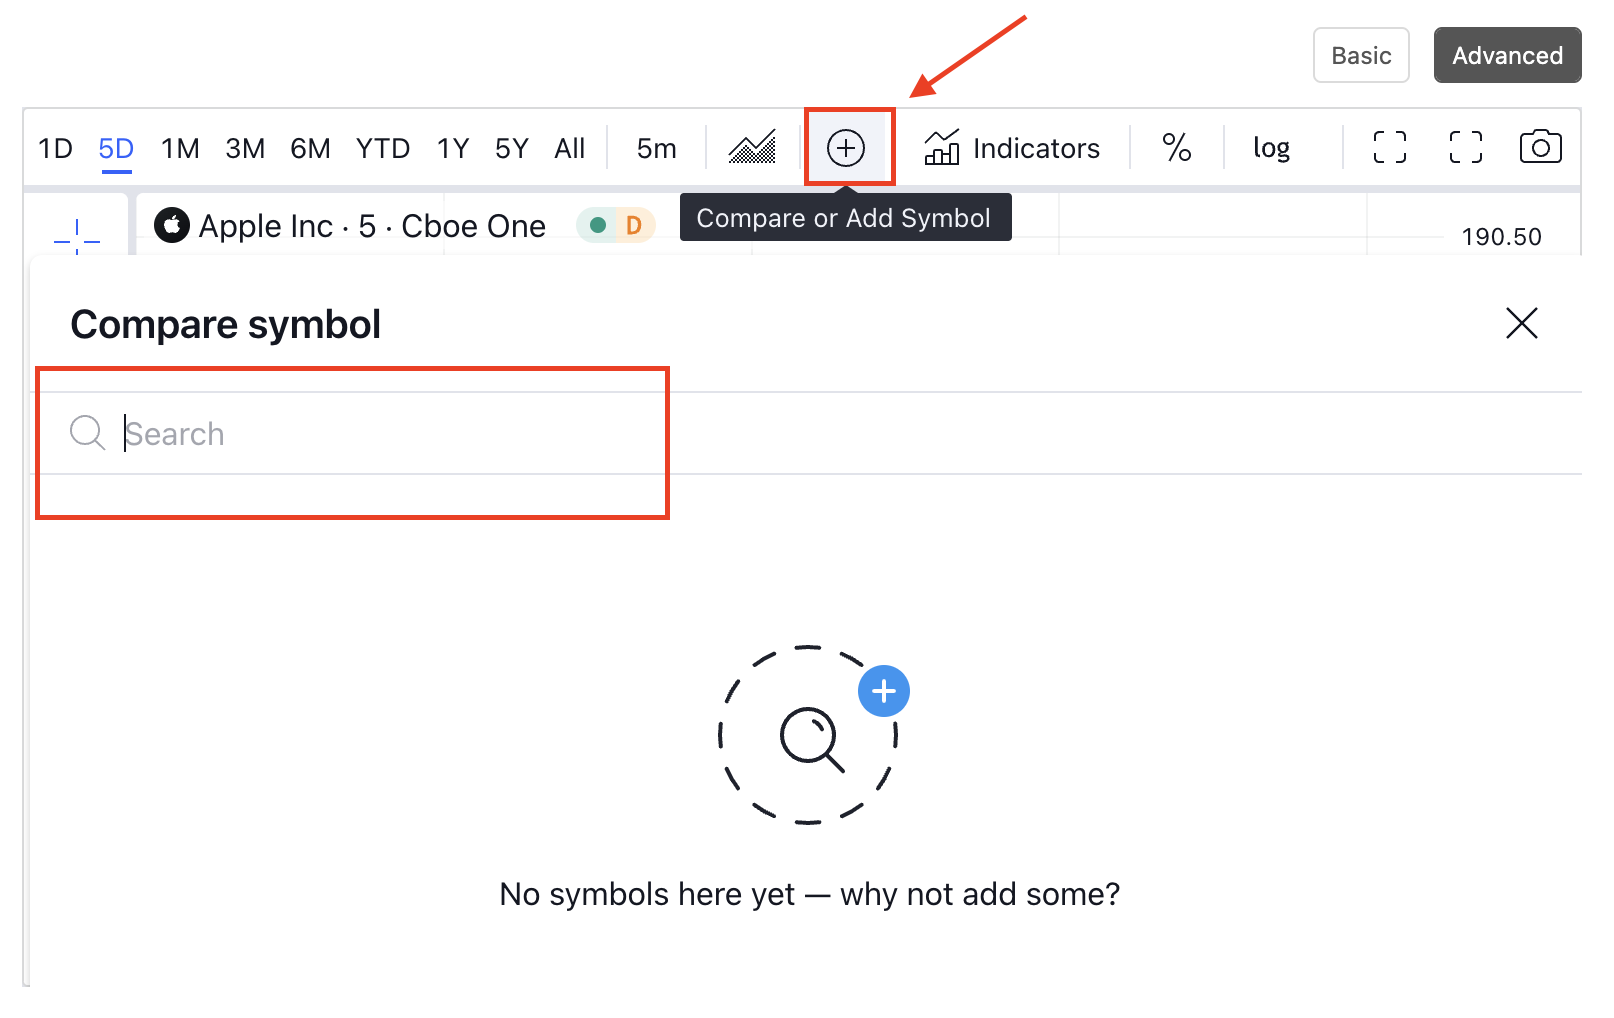
Compare (+) - you can compare stocks easily using this feature.
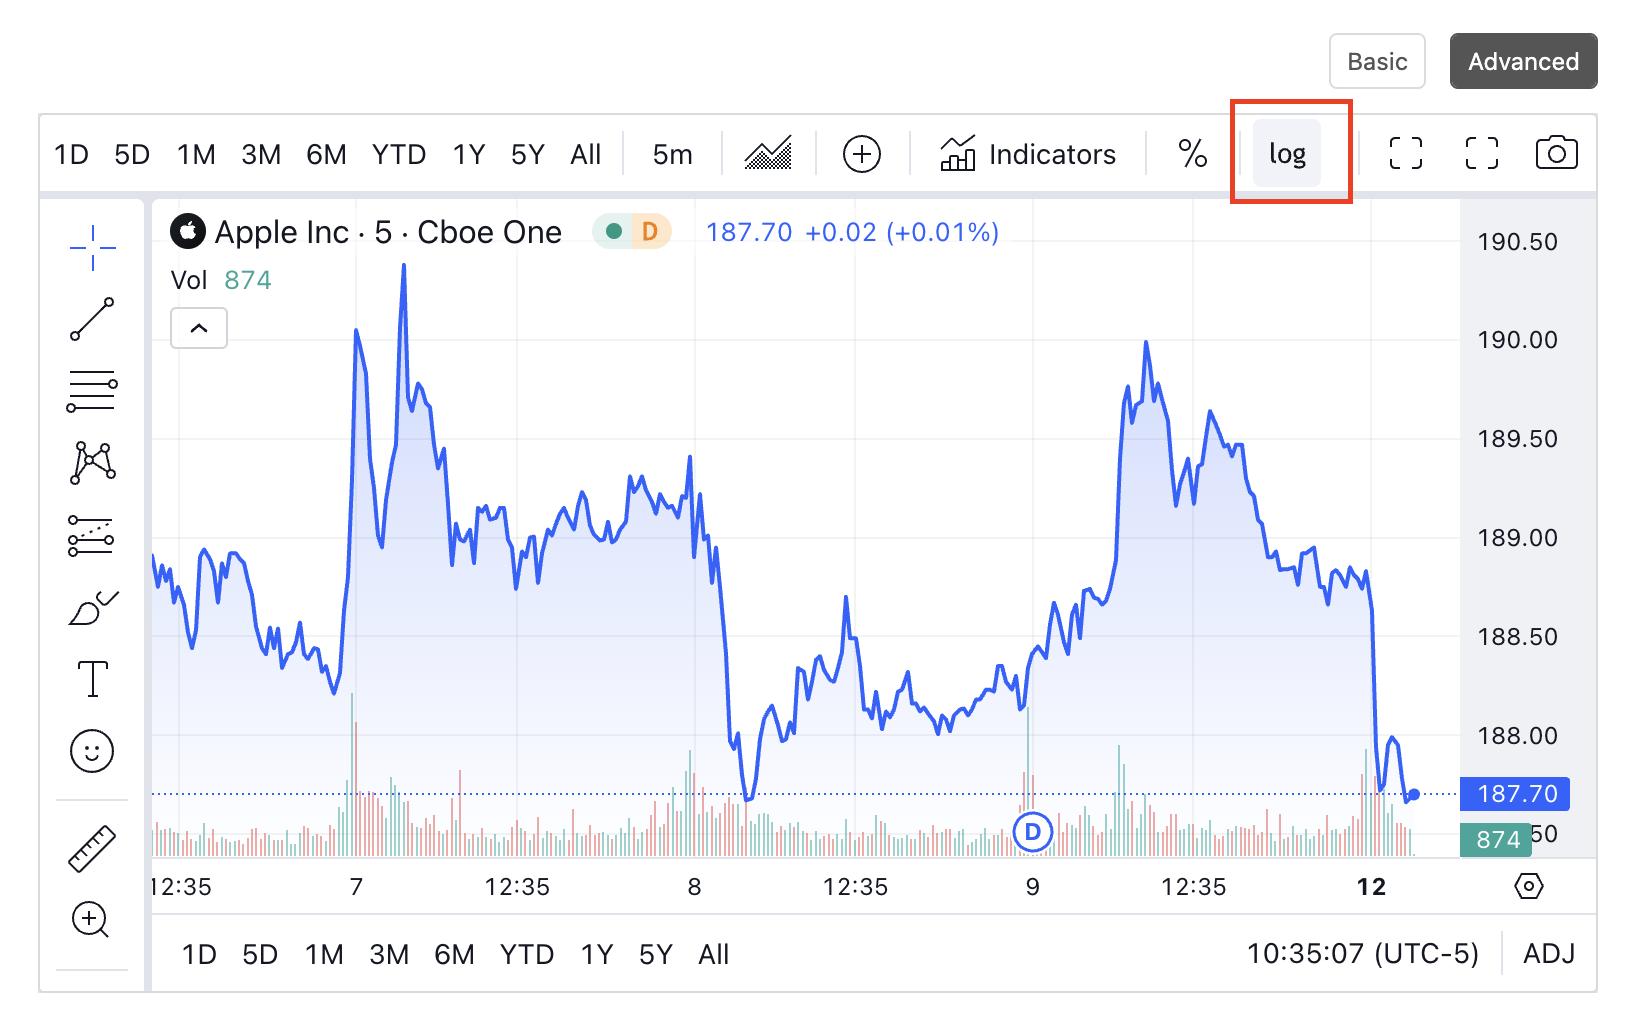
Log - helps you to toggle between log and non-log values
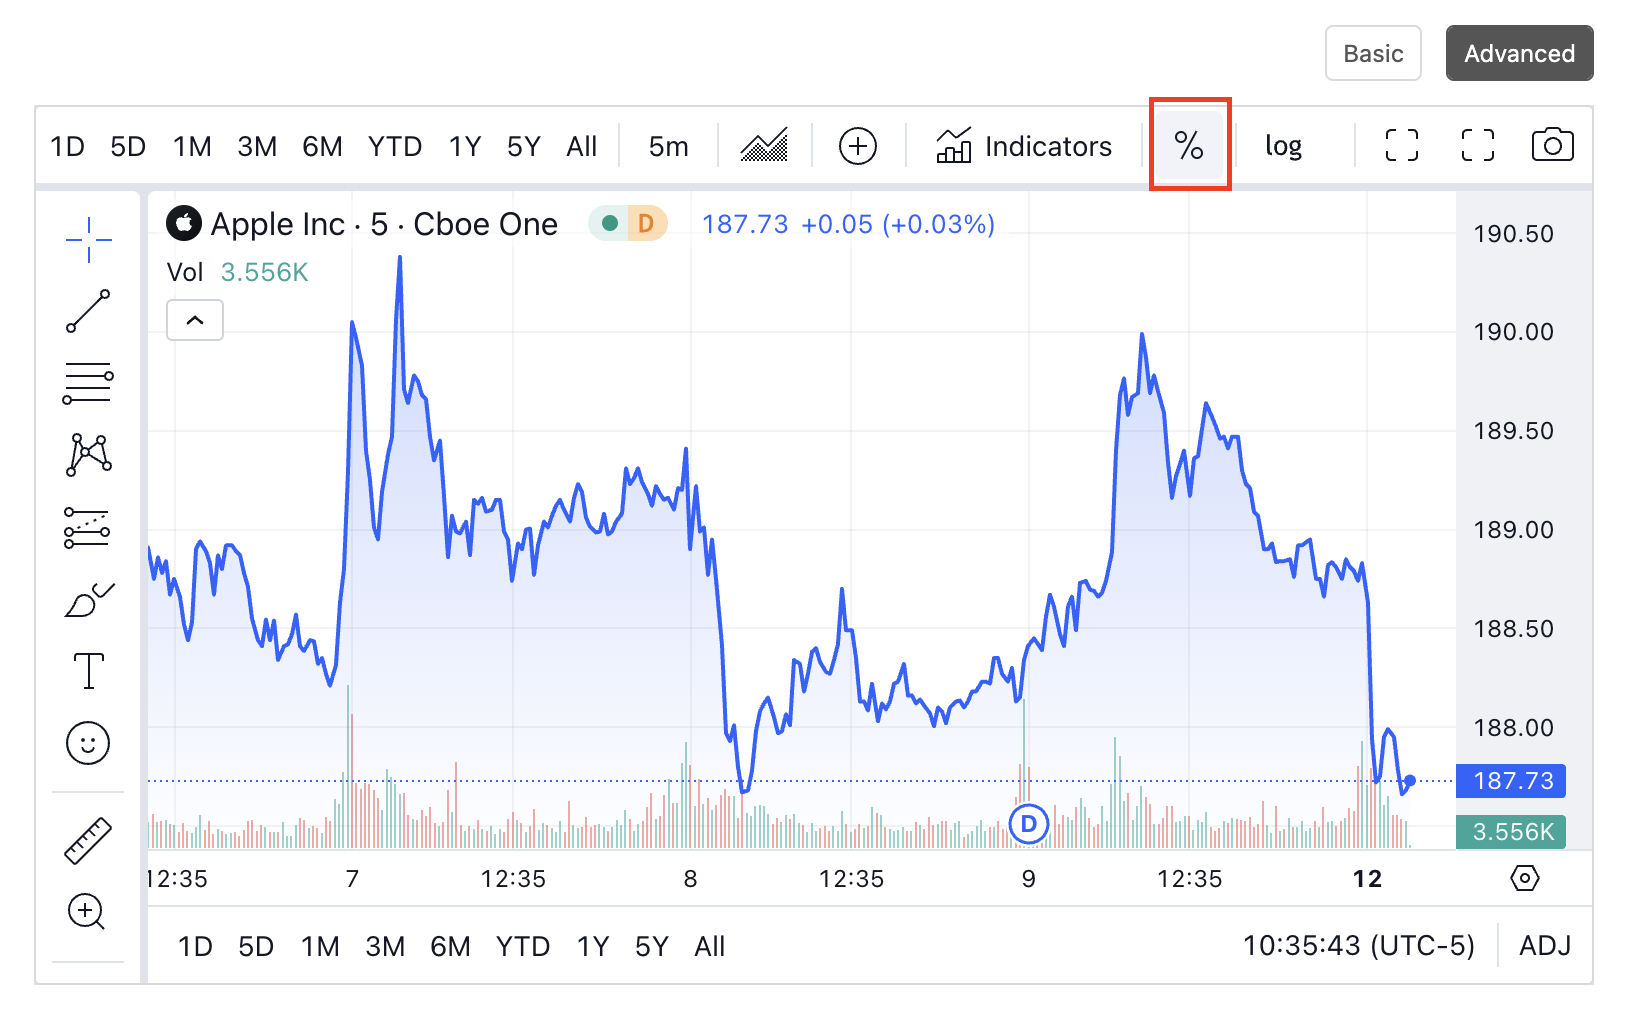
Percentage - helps you to change between the percentage and absolute values.
Indicator dropdown - you can choose from a comprehensive list of indicators using this button (maximum 3 can be used at a time).
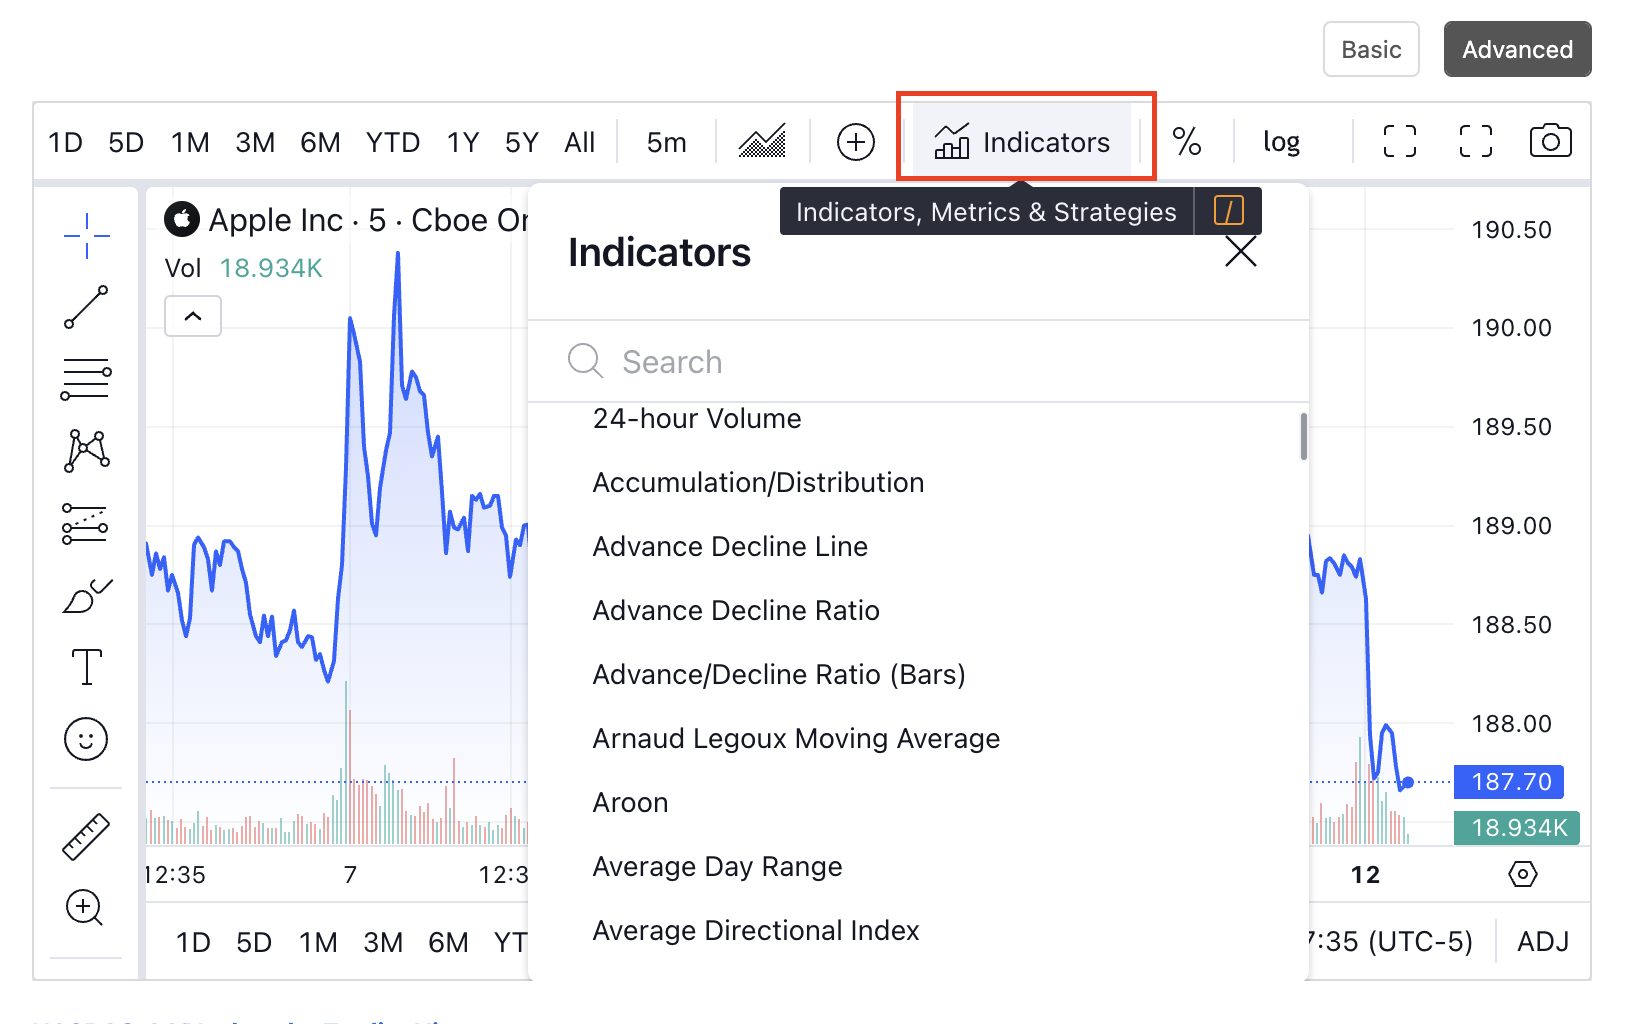
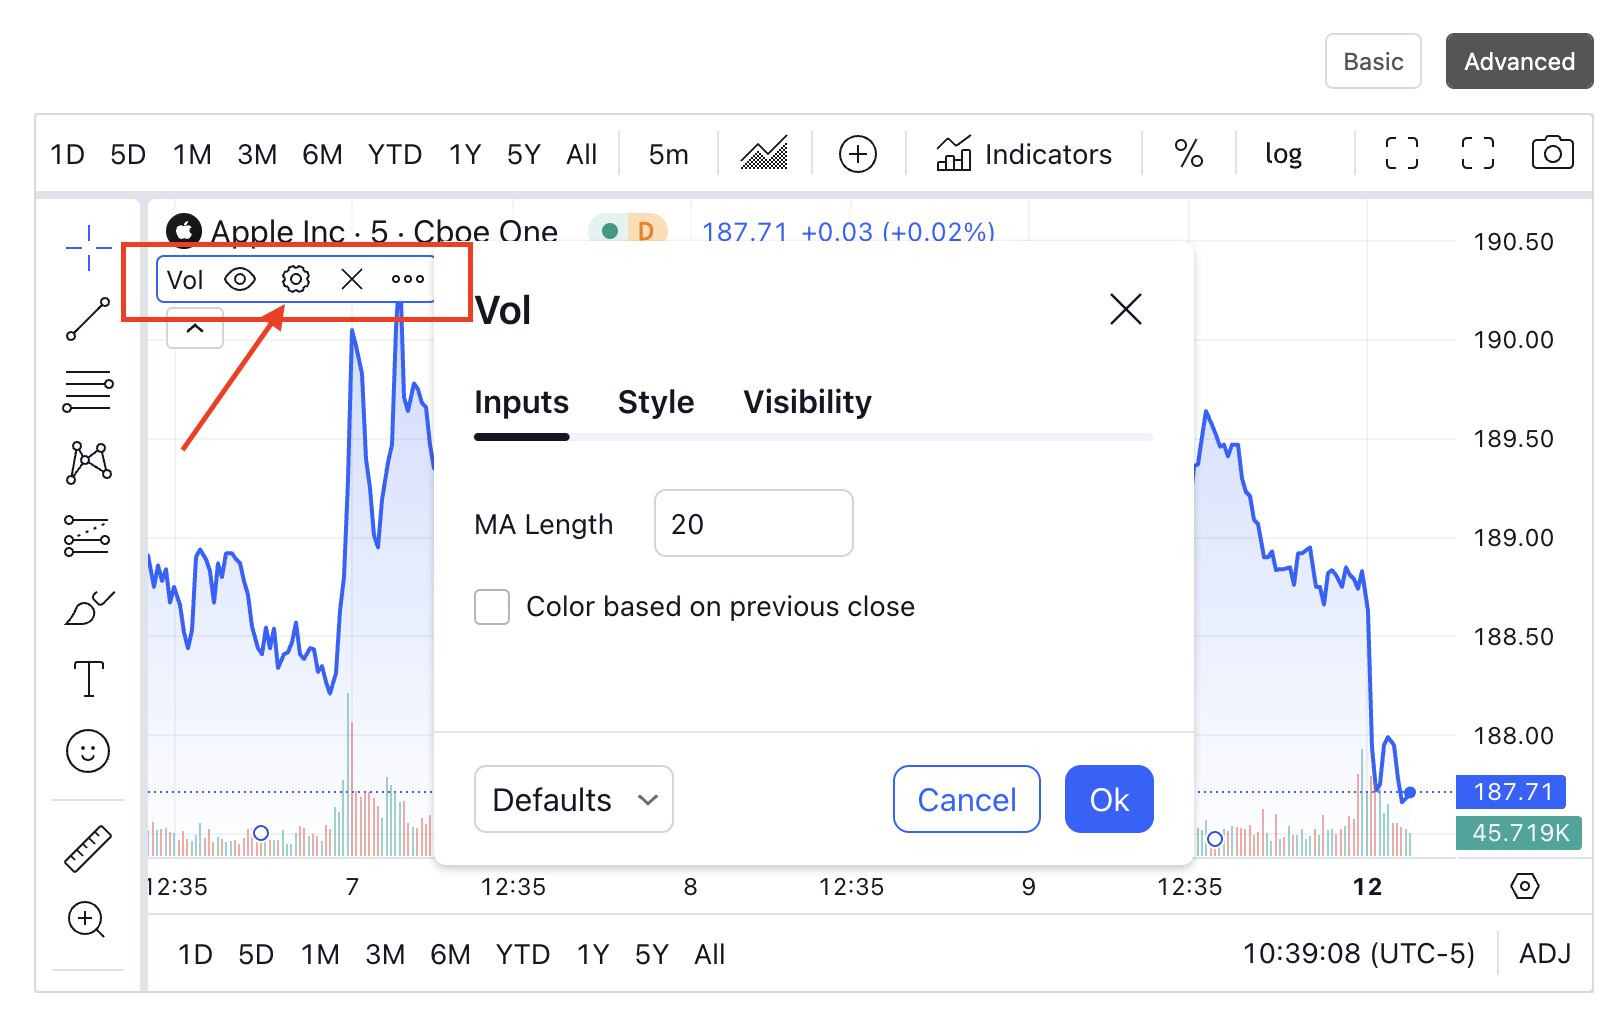
You can further change the settings of those indicators by hovering over the indicator (24H Volume in this case) and clicking the settings button pointed as below.
To remove the indicator you can click on "X" next to the settings button.
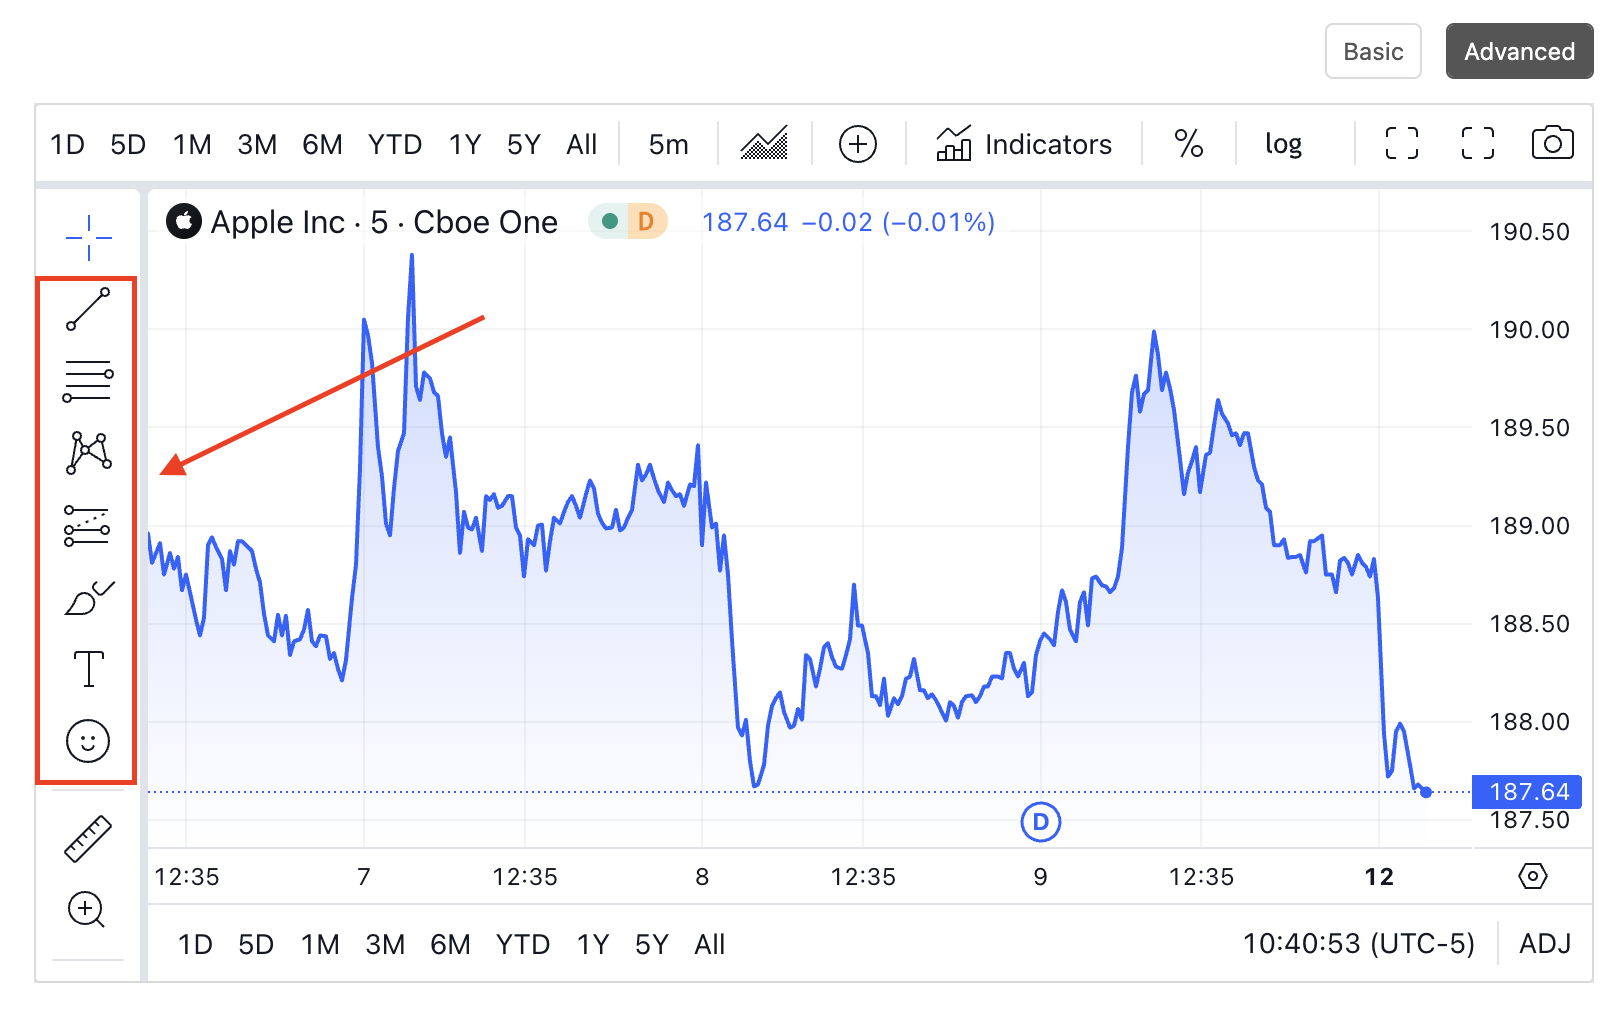
The drawing tools section - allows you to create personalized markers on the chart to help you read/analyze the information in a better manner. Create support/resistance lines, trendlines, analyze using Fib and Gann tools.
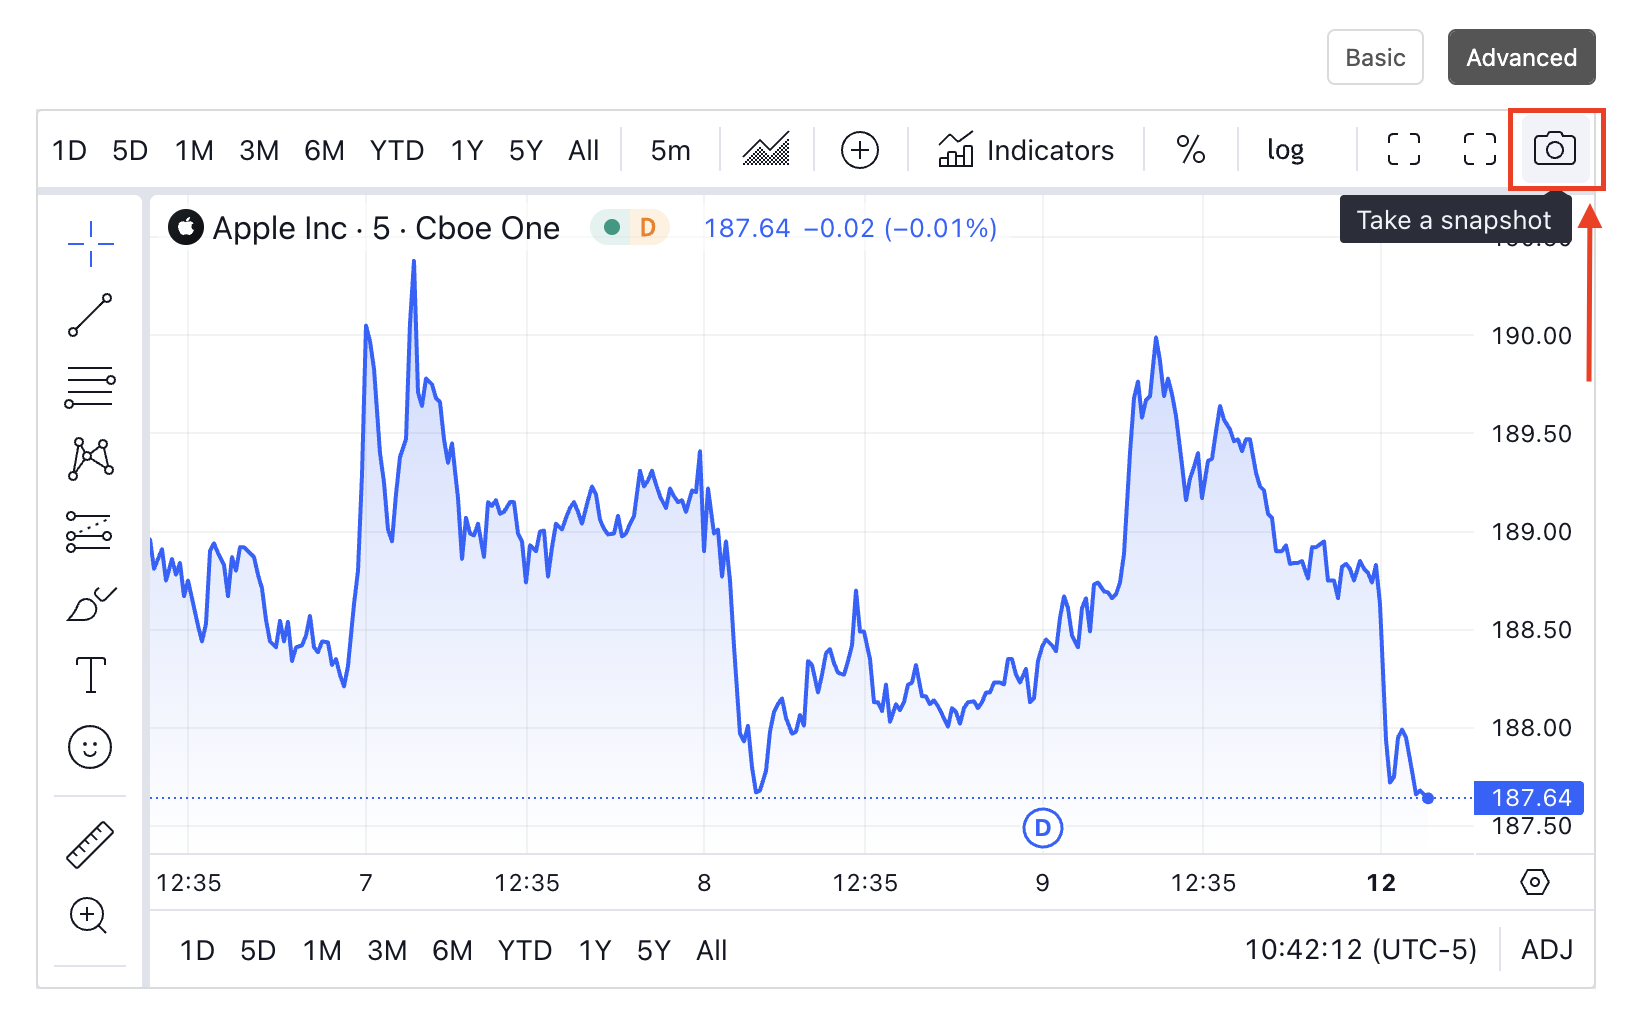
Camera button - You will find this button at the top right corner and can use it to take snapshots of your drawn charts for later reference.
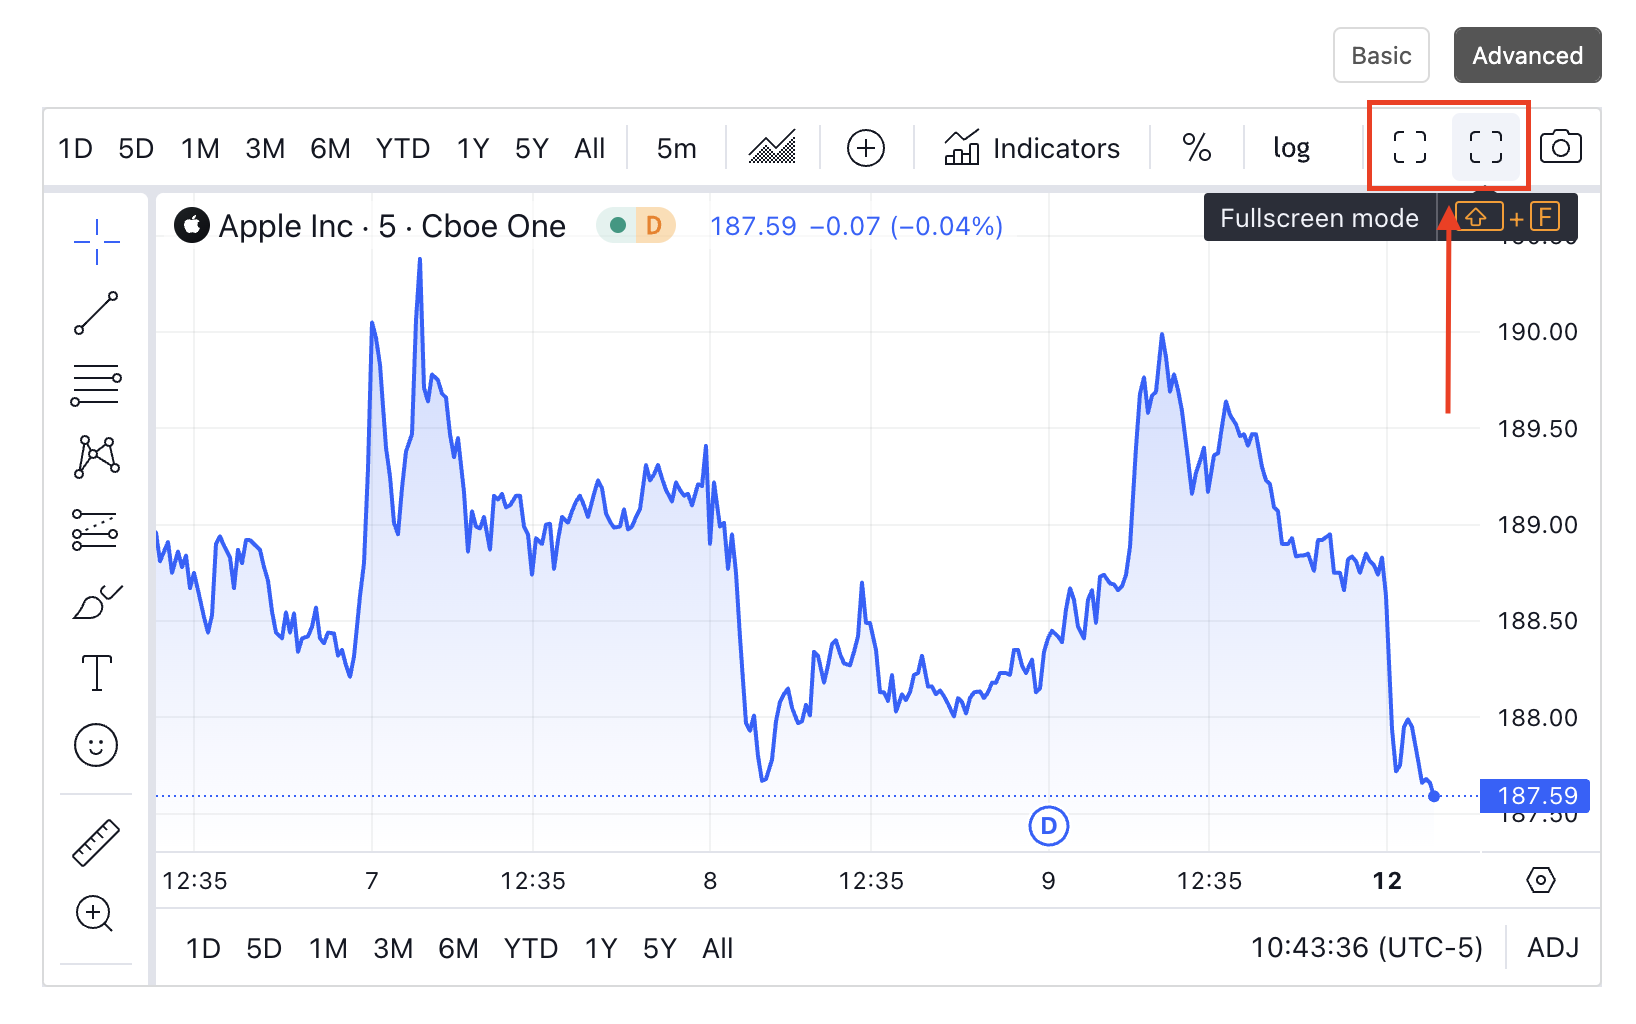
Full Screen View- If you click on the button (as shown below) the chart will expand to the complete screen.
If you haven't subscribed to Premium yet, you can unlock access to our subscriber-only features by signing up here.