
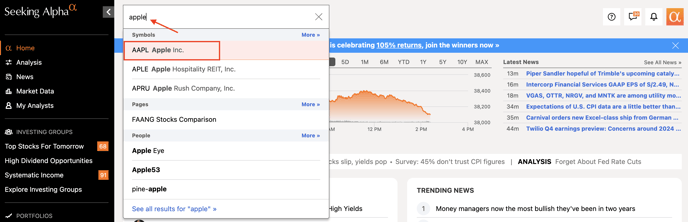
Symbol summary pages are the place many Seeking Alpha members start exploring investing ideas and begin searching for vital company or fund-related information.
You may reach a symbol page by clicking on a ticker symbol or by searching it on the search bar, as shown below:
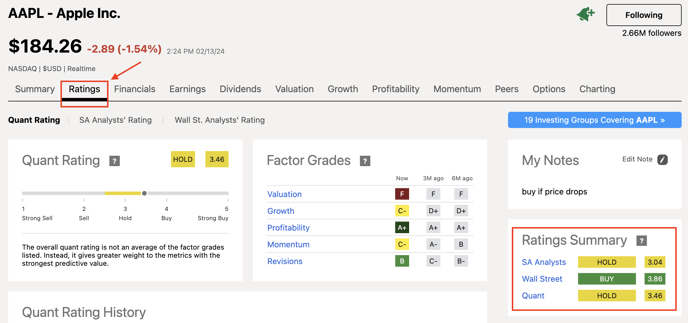
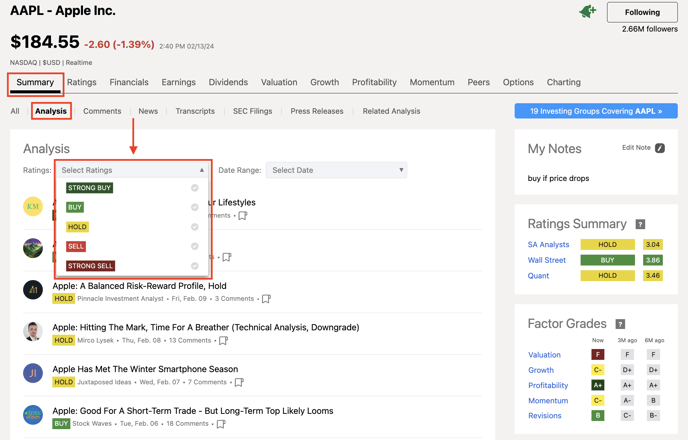
Ratings Summary
It gives you a snapshot of all three Seeking Alpha ratings for every stock - Quant, SA Analyst, and Sell-Side Analyst. Appeals really strongly to retail investors who just want the bottom-line recommendation and brings tremendous value to advanced investors who are looking for a starting point for deeper analysis.
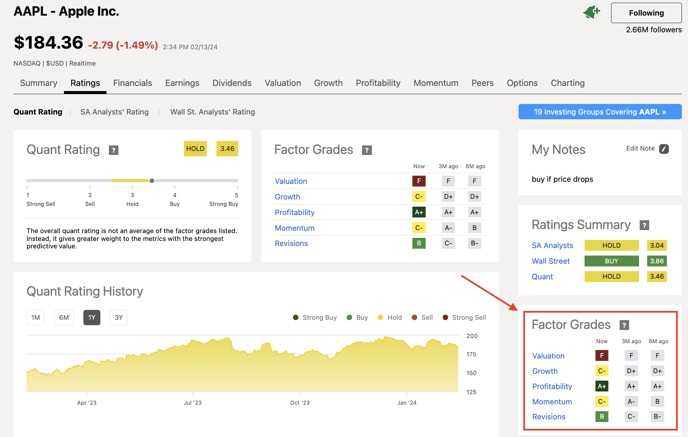
Quant Rating + Factor Grades
Quant Ratings are an objective, unemotional evaluation of each stock based on data, such as the company’s financial statements, the stock’s price performance, and analysts’ estimates of the company’s future revenue and earnings.
Over 100 metrics for each stock are compared to the same metrics for the other stocks in its sector, and overall.
Seeking Alpha grades each stock by five “factors” -- Value, Growth, Profitability, Momentum, and EPS Revisions. To do this, we compare the relevant metrics for the factor in question for the stock to the same metrics for the other stocks in its sector. The factor is then assigned a grade, from A+ to F.
Clicking on any of the Factor Grades (in blue) will bring up a drill-down of that grade's metrics.
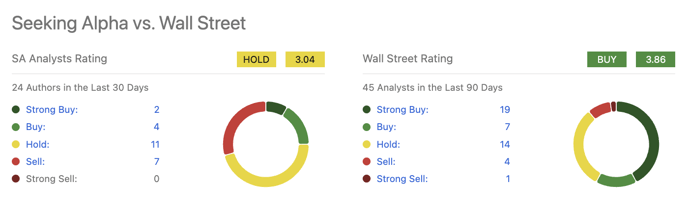
Seeking Alpha vs. Wall Street
Seeking Alpha analysts must declare if they are Strong Buy, Buy, Hold, Sell, or Strong Sell when publishing their articles. Easily compare SA analyst ratings to sell-side Wall Street analyst sentiment.
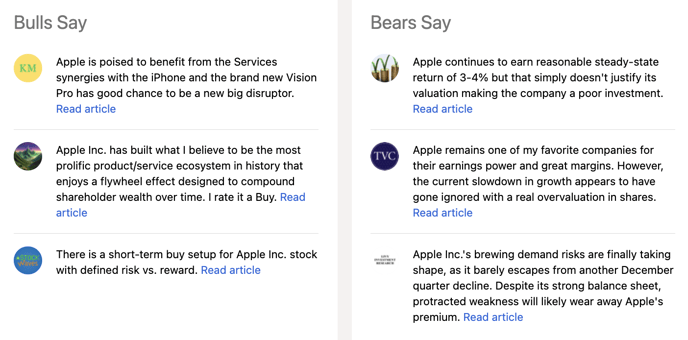
Bulls Say / Bears Say
Concisely presents the main cases to buy or sell the stock for those that don't have time to read all of the opinions offered by SA contributors
Search for Articles
Search for news, analysis, earnings call transcripts and press releases. You can filter articles by clicking on the 'Analysis tab' (under Summary) and selecting one or more of the ratings.
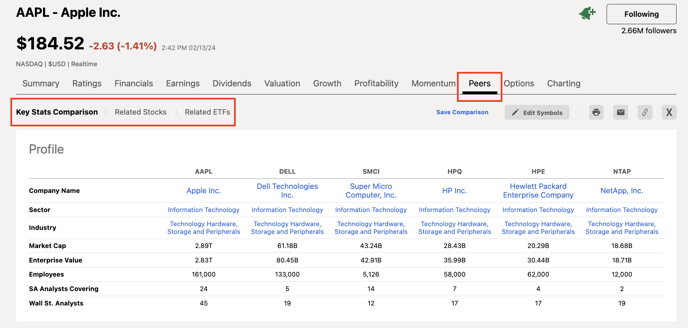
Peers
Under "Related stocks" you can view the stocks similar to a stock of your choice, and with the "Key Stats Comparison" tool you can compare six stocks side by side, including their key data, ratings, and factor grades. You can change the stocks in the comparison and download the results as a spreadsheet or PDF.
Please email us at subscriptions@seekingalpha.com or give us a call at 1-347-509-6837 if you need any help.
If you haven't subscribed to Premium yet, you can unlock access to our subscriber-only features by signing up here.