Quant Ratings and Factor Grades FAQ
Watch this video to learn how to get the most out of your Premium subscription and understand how our Rating systems can help you make smarter investing decisions:

What are Seeking Alpha’s Quant Ratings and Factor Grades?
Seeking Alpha’s Quant Ratings are an objective, unemotional evaluation of each stock based on data, such as the company’s financial statements, the stock’s price performance, and analysts’ estimates of the company’s future revenue and earnings. Over 100 metrics for each stock are compared to the same metrics for the other stocks in its sector. The stock is then assigned a rating (Strong Buy, Buy, Hold, Sell, or Strong Sell), and a score (from 1.0 to 5.0, where 1.0 is Strong Sell and 5.0 is Strong Buy).
Seeking Alpha grades each stock by five “factors” -- Value, Growth, Profitability, Momentum and EPS Revisions. To do this, we compare the relevant metrics for the factor in question for the stock to the same metrics for the other stocks in its sector. The factor is then assigned a grade, from A+ to F.
How are Seeking Alpha’s Quant Ratings and Factor Grades useful for investors?
Seeking Alpha’s Quant Ratings Factor Grades provide investors with an instant characterization of each stock. This makes it easy to find or rule out stocks based on your investment criteria.
For investors wanting to do more research, the Quant Ratings and Factor Grades provide a springboard for further research. You can quickly see where a stock is strong or weak, and with one click you can view the underlying data and sector averages to perform your own evaluation.
Who is responsible for Seeking Alpha's Quant Ratings and Factor Grades, and what credibility do they have?
Seeking Alpha's Quant Ratings and Factor Grades are designed and managed by Steve Cress. Steve has 30 years of experience in equity research, quant strategies and risk management, and founded quant hedge fund Cress Capital Management. Steve is now Seeking Alpha's Head of Quant Strategy.
Are the Quant ratings and Factor Grades for short term investors or long term investors?
The Quant Ratings and Factor Grades are appropriate for both short and long term investors. The Value, Growth and Profitability factors identify mis-priced securities, and the Momentum and EPS Revisions factors identify timeliness. Timeliness isn’t only for short term investors. Even deep value investors are aware that securities can remain mis-priced for long periods of time without a catalyst. The overall Quant Rating therefore attempts to identify mis-pricing and timeliness in a single rating, and that’s actionable for both long term and short term investors.
Why are the Quant Ratings and Factor Grades built on a comparison of stocks to others in the same sector, instead of a comparison of all stocks to each other?
Different sectors have different aggregate profitability and growth rates, and therefore trade at different average valuations. Comparing a stock to others in its sector is therefore more relevant and informative than comparing it to stocks in other sectors. Because the market adjusts a sector’s aggregate valuation based on its profitability and growth rate, a stock’s sector-relative Quant Ratings and Factor Grades are therefore a good indicator of its overall attractiveness.
How frequently are the Quant Ratings updated?
Once per day, before market opens.
Which stocks are covered by the Quant Ratings and Factor Grades, and which aren’t?
Our Quant Ratings and Factor Grades currently cover about 5,600 stocks. They do not cover stocks which have no sell-side analyst coverage, because analyst estimates of future revenue and earnings, and revisions to those estimates are key inputs for our Quant Ratings and Factor Grades. Our Quant Ratings and Factor Grades do cover ADRs, but currently do not cover stocks trading on foreign exchanges.
In some cases, the overall Quant Rating does not seem to reflect the average of the Factor Grades. Why not?
The overall Quant Rating is not a simple average of the Factor Grades. To maximize the predictive value of the Quant Rating, some factors are weighted higher than others, and if a stock scores very badly on one factor, it is disqualified as anything higher than a Neutral. The disqualifying grades are: a D+ or worse for Growth, Momentum and EPS Revisions, and a D- or worse for Value and Profitability. The overall Quant Rating also takes account of a stock's size and risk, which are not included in the Value, Growth, Profitability, Momentum and EPS Revisions grades.
In determining the Value Grade, why don’t you use a discounted cash flow model or the stock’s average historical valuation to determine fair value?
Discounted cash flow, "DCF", models are highly sensitive to the company’s assumed long term growth rate. A small change in the company’s assumed long term growth rate can have a large impact on the resulting “fair value” for the stock. Yet long term growth rates are extremely hard to estimate with precision, and analysts have few tools, other than guesswork, for estimating them. This limits the usefulness of discounted cash flow models for assessing a stock’s fair value.
Valuing a stock based on its historical valuation multiples (such as its average P/E over the last three years) suffers from a different problem. Valuation multiples tend to move with market sentiment, interest rates and economic optimism. They can shift dramatically over time. Comparing stocks’ historical valuation to their current valuation is therefore a better indicator of overall market sentiment than it is a useful tool for indicating a stock’s fair value. In some periods, for example, using historical average valuations to value stocks would have told the investor that almost all stocks were overvalued. But that’s a market call, and does not help the investor answer the question: If I want to own stocks, which are most attractively valued?
Our approach allows the investor to decide whether in principle to hold stocks, ie. whether the market is overall attractive, and then provides the investor with rigorous tools for assessing which stocks are relatively most attractive based on valuation.
Where do I find the Quant Ratings and Factor Grades?
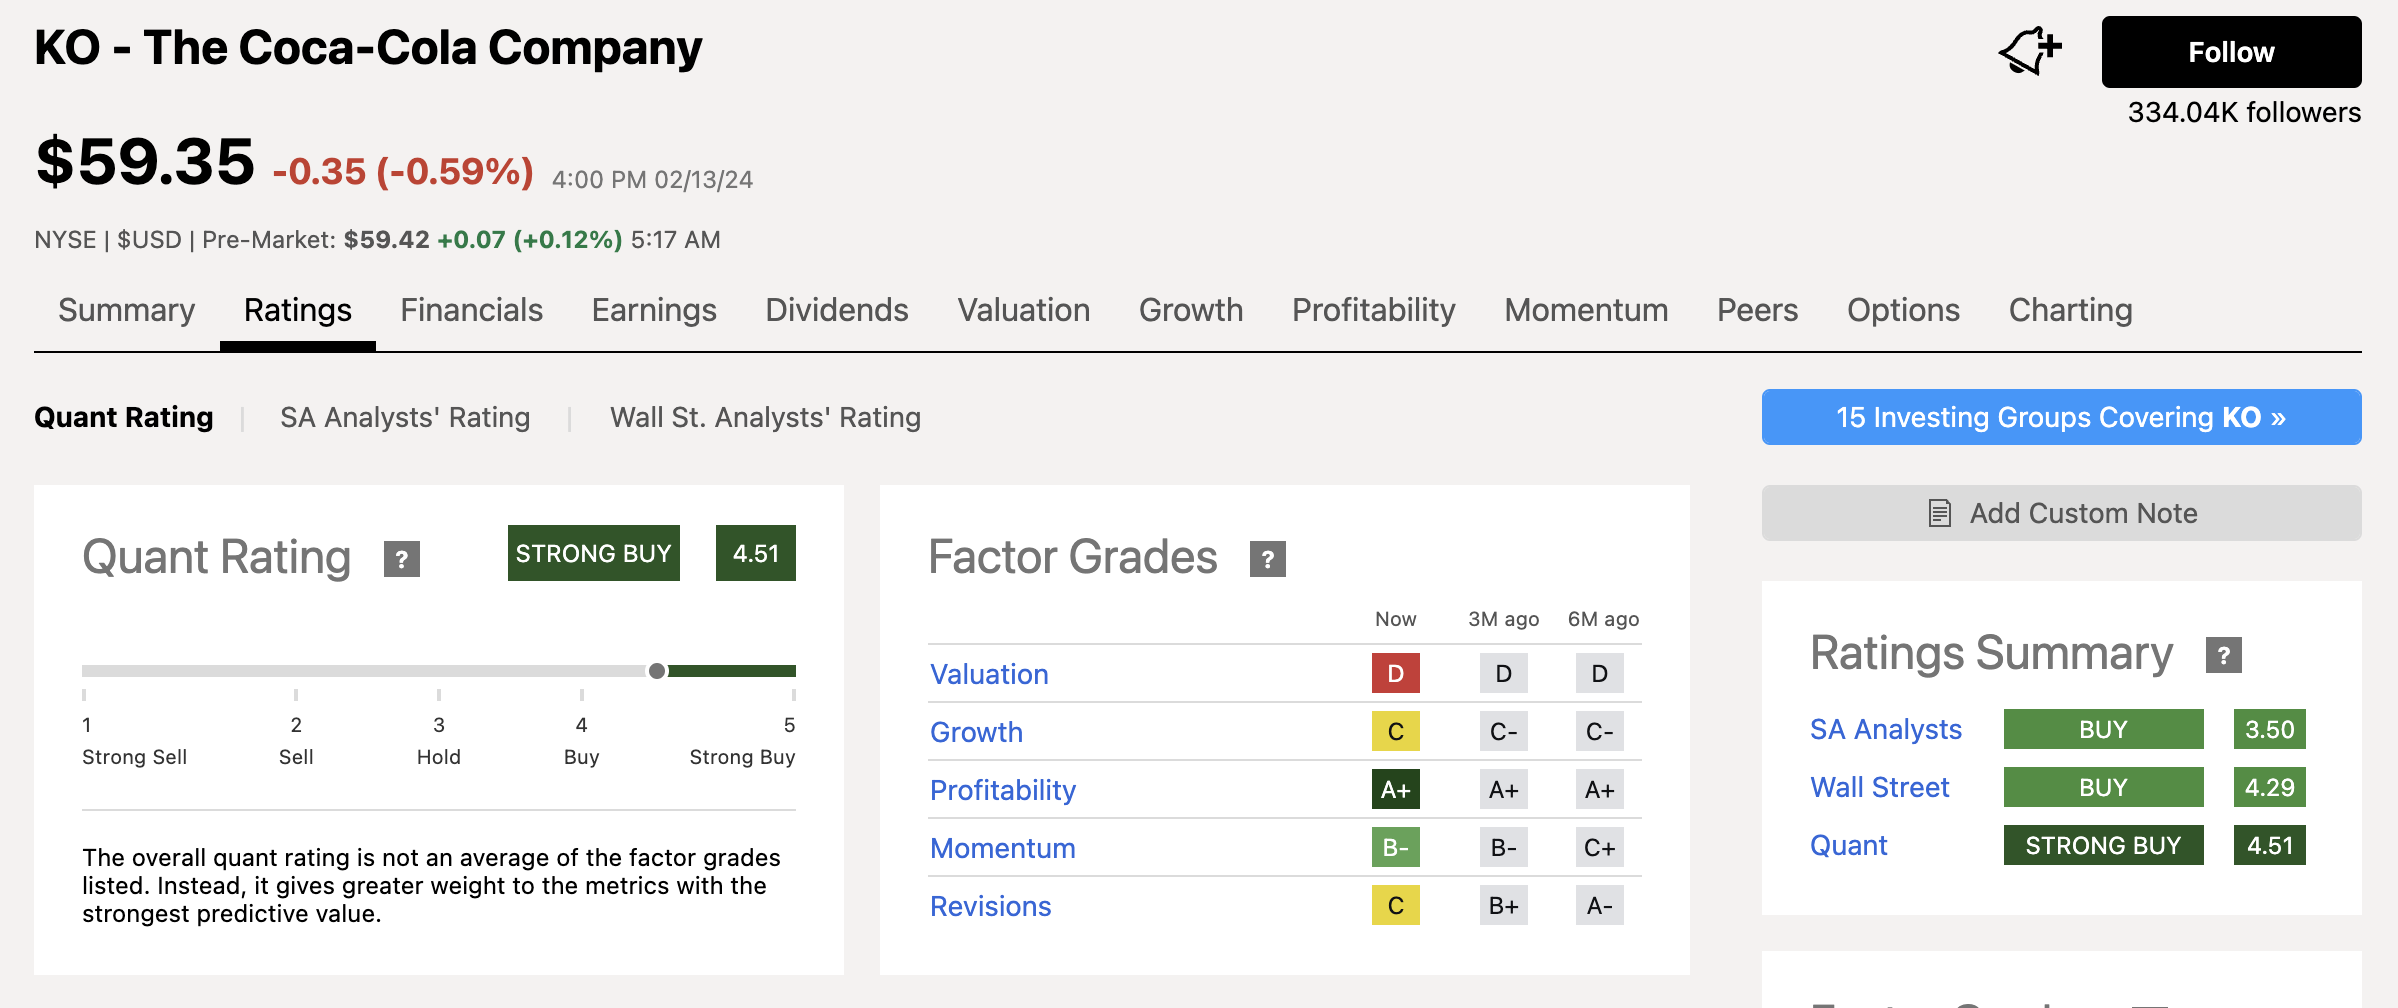
Quant Ratings and Factor Grades are displayed on symbol pages for paying subscribers. To see them, (i) ensure you are logged in to the desktop website as a paying subscriber or in free trial, (ii) enter the stock symbol in the search box at the top of the page, (iii) hit Return, (iv) when you land on the symbol page, you'll see the Quant Rating in the right hand column (where ads are for free users) in the Ratings Summary box, above the SA Authors' Rating and Wall St. (sell side) Rating. The Factor Grades are in the Quant Rating Box immediately below that. In addition,we have added the Quant Ranking card below Factor Grades.
Here's what you see for The Coca-Cola Company:
How can I see the Quant Ratings and Factor Grades without paying for a subscription?
If you haven't subscribed to Premium yet, you can unlock access to our subscriber-only features by signing up here.