Chart price changes are inaccurate

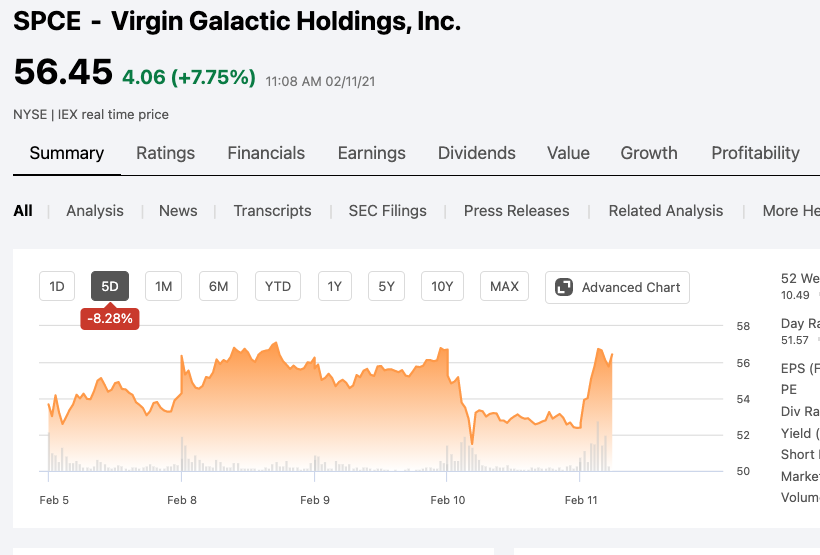
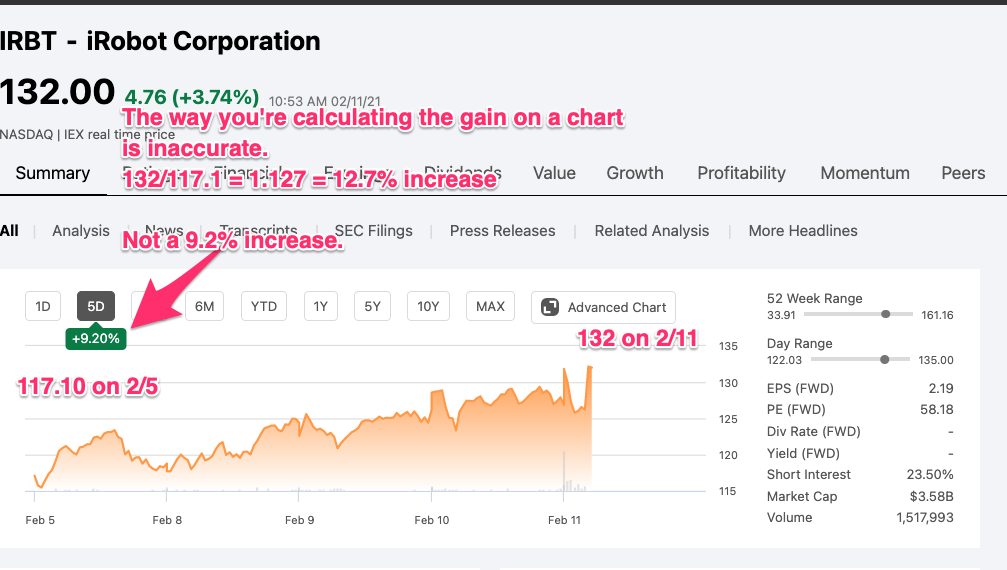
The way you calculate chart price changes by period is wildly inaccurate. If you look at SPCE today over the 5 day period, the callout displayed on the chart indicates that it's down 8.28% over the 5 day period.
However, since the start date price was 53.67 and the current price is 56.31, it's actually UP by 4.92%
Since this is completely inaccurate, it makes the charts unusable.
I've included a couple of examples below.
I noticed if you go to the advanced chart you'll get different %'s. It's confusing and can be wildly different. Maybe the advanced chart is accurate? Of course on mobile you can't get the advanced chart.