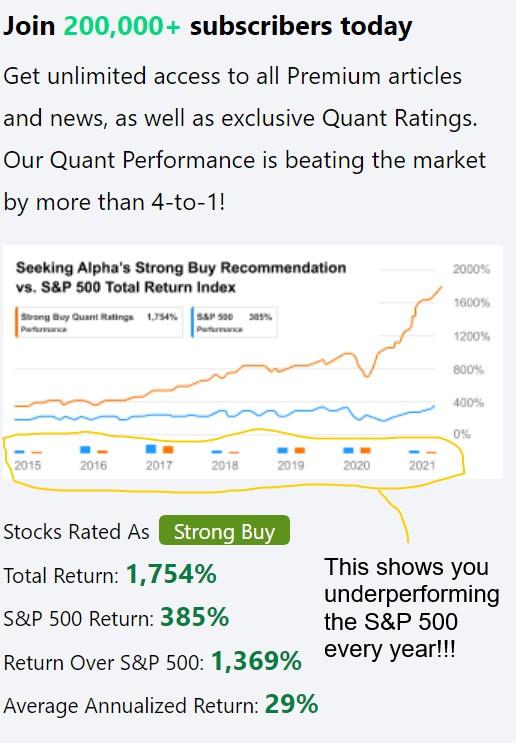
Strong Buy Quant Performance

I was thinking of subscribing until I saw this graphic. It appears to show you under-performing the S&P 500 in the bar chart and out-performing the S&P 500 in the line chart.
Did your graphics department make a mistake or are you misleading potential customers?
Care to clarify?
I place zero faith in the Quant Ratings...Rebalance daily???? Signals go from Strong Buy to Sell overnight?? Tech Support wrote me when I brought it to their attention,and they said there are data issues which cause this issue.. .And lets be real.If anyone had a aystem that outperformed the SP 4-1,why on earth arent they managing billions??.
Try asking them how their strong buys perform without "rebalancing daily" and using different holding periods/rebalancing time frames...
IMHO,its a scam...