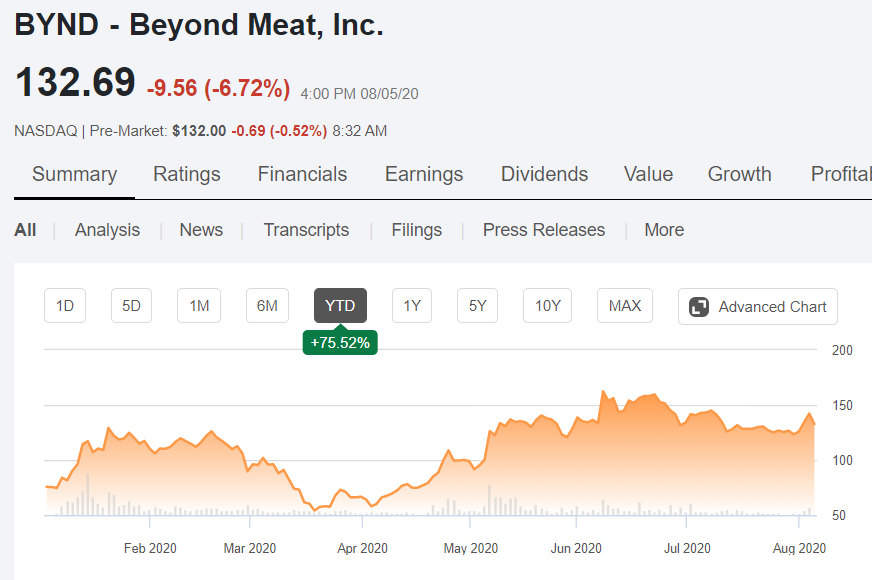
% increase/decrease listed on the chart below the time period selection is wrong!

On summary page the % increase or decrease listed on the chart below the time period selection is wrong! It doesn't match total return % or price return %. Fix it.
On summary page the % increase or decrease listed on the chart below the time period selection is wrong! It doesn't match total return % or price return %. Fix it.
can you specify which ticker you're looking at?
I compared BYND's chart and momentum tab and it seems ok i.e. the return on the chart is the price return.
VS
Regards,
Kushal Mehrotra
Data QA Analyst, Seeking Alpha
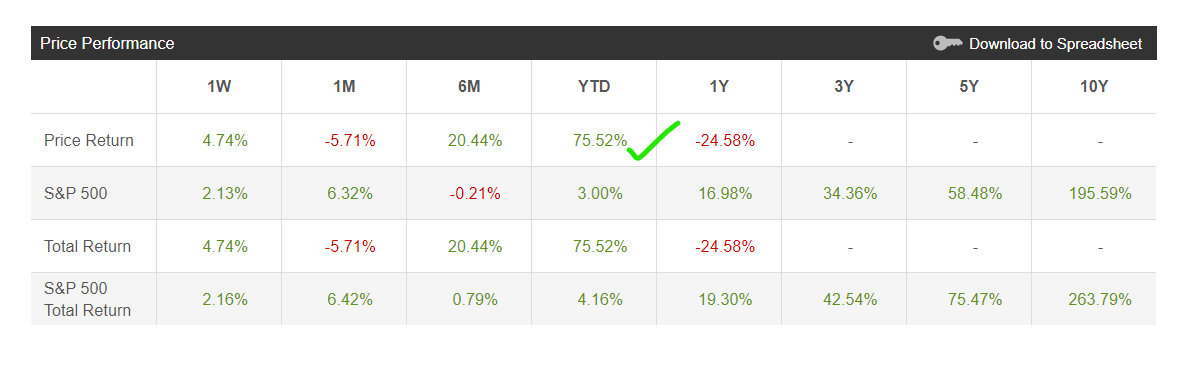
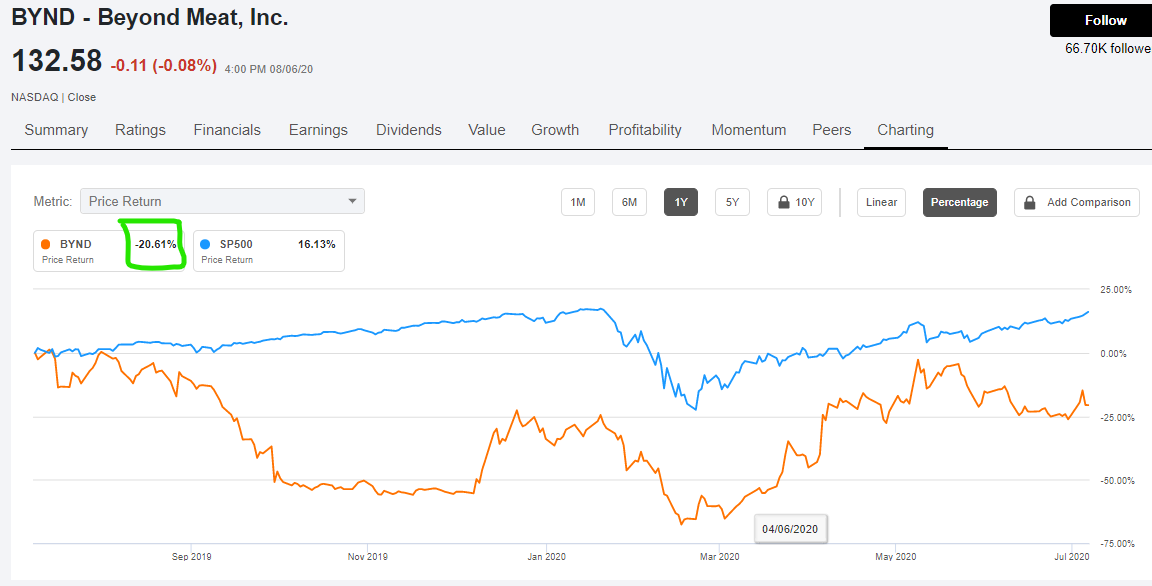
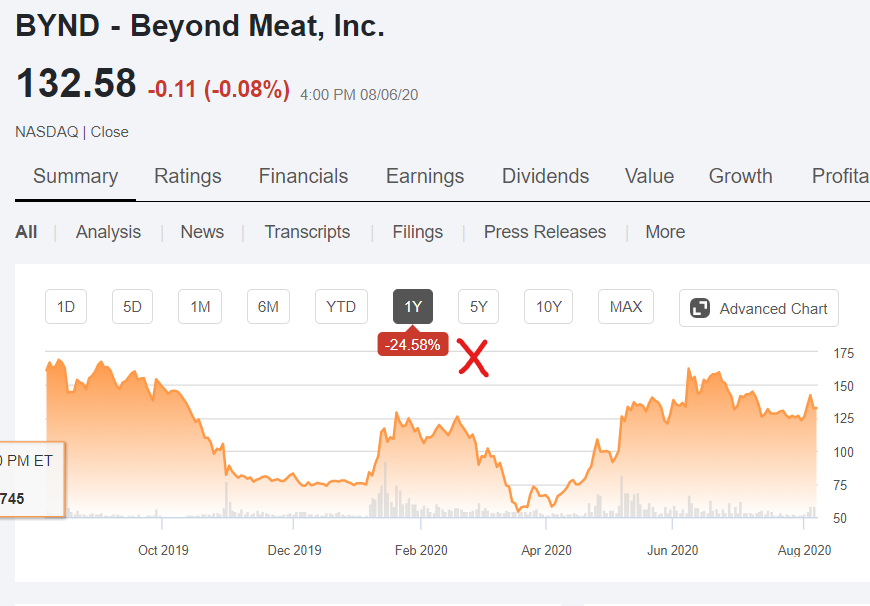
I was looking at the 1Y price return on SP500, but the same problem with all. Using your example (BYND), you can see the 1Y price return from momentum tab is -24.58 which is same as summary tab but wrong. Check 1Y price return on Charting tab and it shows -20.61 which is correct when checked manually (price = 167.00 on Aug 7, 2019). So, it looks like Summary and Momentum tabs have wrong numbers for % Price Return. Check the numbers manually and you will see.

can you specify which ticker you're looking at?
I compared BYND's chart and momentum tab and it seems ok i.e. the return on the chart is the price return.
VS
Regards,
Kushal Mehrotra
Data QA Analyst, Seeking Alpha
Thanks for your response. I'll investigate the issue further and will get back to you with my findings.
-Kushal